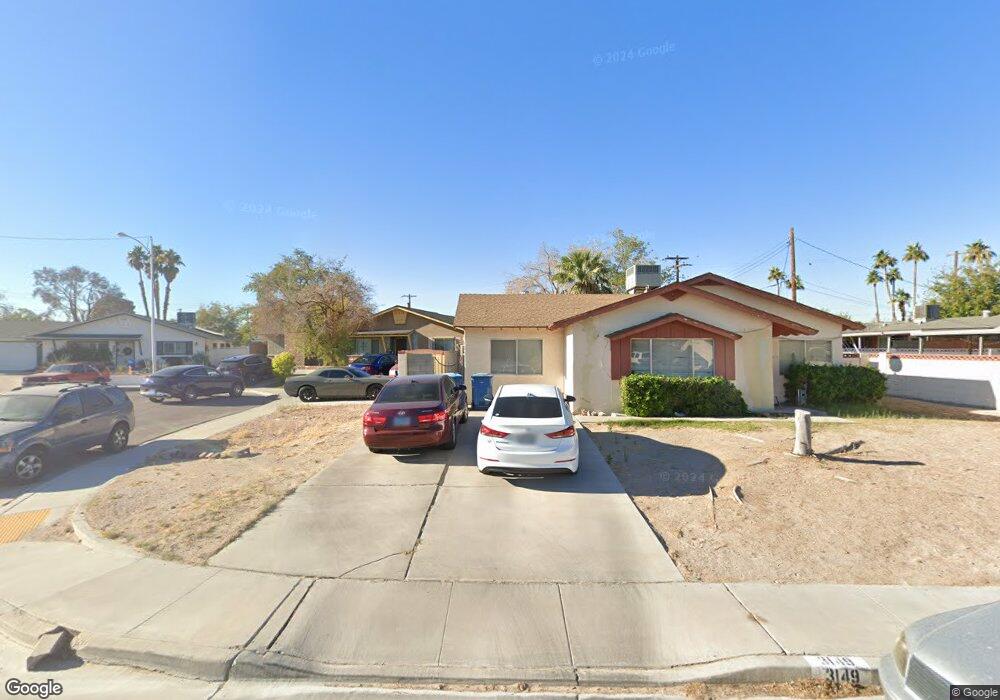
3149 Westfield Cir Las Vegas, NV 89121
Estimated Value: $318,519 - $380,000
3
Beds
2
Baths
1,183
Sq Ft
$291/Sq Ft
Est. Value
About This Home
This home is located at 3149 Westfield Cir, Las Vegas, NV 89121 and is currently estimated at $344,630, approximately $291 per square foot. 3149 Westfield Cir is a home located in Clark County with nearby schools including Will Beckley Elementary School, Jerome Mack Middle School, and Chaparral High School.
Ownership History
Date
Name
Owned For
Owner Type
Purchase Details
Closed on
Sep 21, 2016
Sold by
Rosenberg Natalie
Bought by
Rosenberg Natalie Marlia and Rosenberg Steven Neil
Current Estimated Value
Purchase Details
Closed on
Aug 18, 2014
Sold by
Over Harold W
Bought by
Over Harold W and Harold W Over Revocable Trust
Purchase Details
Closed on
Jun 9, 1998
Sold by
Byrne Mary L and Bolls Mary L
Bought by
Over Harold W
Home Financials for this Owner
Home Financials are based on the most recent Mortgage that was taken out on this home.
Original Mortgage
$97,930
Interest Rate
7.17%
Mortgage Type
FHA
Purchase Details
Closed on
Oct 25, 1993
Sold by
Holmes Kay L
Bought by
Bolls Mary L
Home Financials for this Owner
Home Financials are based on the most recent Mortgage that was taken out on this home.
Original Mortgage
$49,000
Interest Rate
6.97%
Create a Home Valuation Report for This Property
The Home Valuation Report is an in-depth analysis detailing your home's value as well as a comparison with similar homes in the area
Home Values in the Area
Average Home Value in this Area
Purchase History
| Date | Buyer | Sale Price | Title Company |
|---|---|---|---|
| Rosenberg Natalie Marlia | -- | None Available | |
| Over Harold W | -- | None Available | |
| Over Harold W | $99,000 | Old Republic Title Company | |
| Bolls Mary L | -- | First American Title Company |
Source: Public Records
Mortgage History
| Date | Status | Borrower | Loan Amount |
|---|---|---|---|
| Previous Owner | Over Harold W | $97,930 | |
| Previous Owner | Bolls Mary L | $49,000 |
Source: Public Records
Tax History Compared to Growth
Tax History
| Year | Tax Paid | Tax Assessment Tax Assessment Total Assessment is a certain percentage of the fair market value that is determined by local assessors to be the total taxable value of land and additions on the property. | Land | Improvement |
|---|---|---|---|---|
| 2025 | $750 | $45,783 | $28,350 | $17,433 |
| 2024 | $728 | $45,783 | $28,350 | $17,433 |
| 2023 | $764 | $50,427 | $34,650 | $15,777 |
| 2022 | $707 | $39,984 | $25,900 | $14,084 |
| 2021 | $655 | $36,560 | $23,450 | $13,110 |
| 2020 | $605 | $36,901 | $24,150 | $12,751 |
| 2019 | $567 | $31,877 | $19,600 | $12,277 |
| 2018 | $541 | $28,705 | $17,150 | $11,555 |
| 2017 | $818 | $27,904 | $16,450 | $11,454 |
| 2016 | $514 | $22,570 | $11,550 | $11,020 |
| 2015 | $512 | $19,779 | $9,100 | $10,679 |
| 2014 | $496 | $17,047 | $7,000 | $10,047 |
Source: Public Records
Map
Nearby Homes
- 3169 Nottingham Dr
- 275 Pecos Way
- 3085 Greenbriar Dr
- 241 Pecos Way Unit 6
- 233 Pecos Way
- 3258 Glenhurst Dr
- 3078 S Pecos Rd
- 431 Las Casitas Way
- 3435 Don Miguel Dr
- 747 Greenbriar Townhouse Way
- 3410 Pecos Way
- 3428 Don Miguel Dr
- 3247 Greenbriar Dr
- 3558 Wayne Cir
- 3318 Bancroft Cir
- 565 Greenbriar Townhouse Way
- 335 Greenbriar Townhouse Way
- 3378 Del Marino St
- 225 Greenbriar Townhouse Way
- 3453 Del Marino Dr
- 3132 Nottingham Dr
- 3132 Nottingham Dr Unit n/a
- 3140 Nottingham Dr
- 3155 Westfield Cir
- 3148 Nottingham Dr
- 3165 Westfield Cir
- 3136 Westfield St
- 3144 Westfield St
- 3128 Westfield St
- 3164 Nottingham Dr
- 3169 Westfield Cir
- 3120 Westfield St
- 3152 Westfield St
- 3174 Nottingham Dr
- 3560 Regents Ct
- 3127 Nottingham Dr
- 3135 Nottingham Dr
- 3115 Oxford Ln
- 3554 Regents Ct Unit 2
- 3112 Westfield St