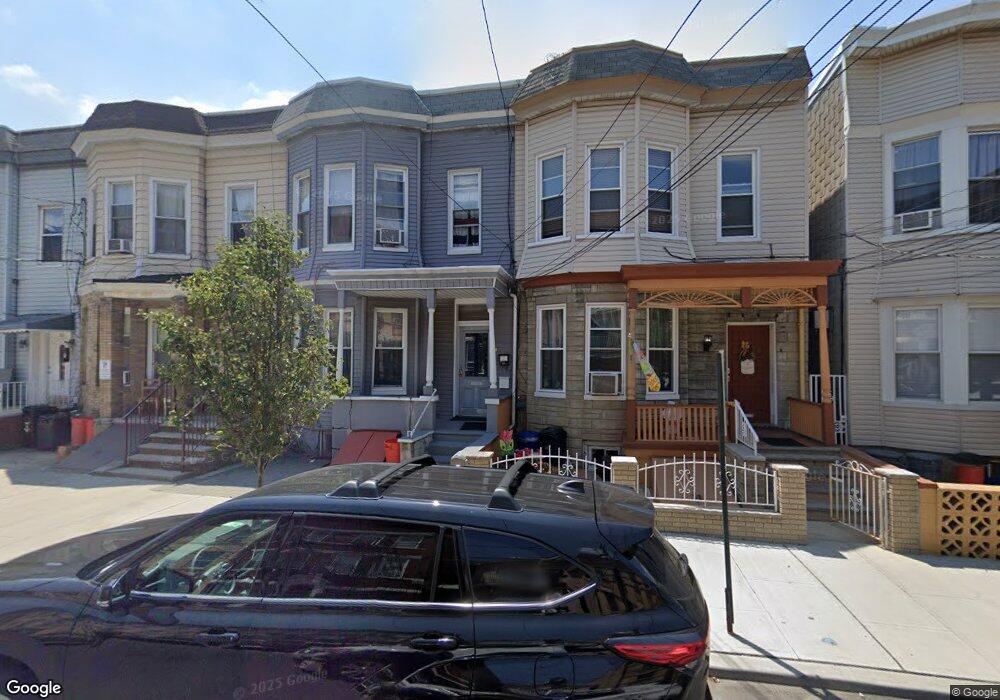
315 28th St Union City, NJ 07087
Estimated Value: $643,000 - $821,000
5
Beds
3
Baths
1,888
Sq Ft
$387/Sq Ft
Est. Value
About This Home
This home is located at 315 28th St, Union City, NJ 07087 and is currently estimated at $731,145, approximately $387 per square foot. 315 28th St is a home located in Hudson County with nearby schools including Robert Waters School, Sara M. Gilmore Academy, and Union Hill Middle School.
Ownership History
Date
Name
Owned For
Owner Type
Purchase Details
Closed on
Jul 7, 2003
Sold by
Mendoza Luis
Bought by
Anticona Marleny
Current Estimated Value
Home Financials for this Owner
Home Financials are based on the most recent Mortgage that was taken out on this home.
Original Mortgage
$239,732
Interest Rate
5.34%
Mortgage Type
Purchase Money Mortgage
Purchase Details
Closed on
Mar 2, 2001
Sold by
Arana Andres A and Arana Irma
Bought by
Mendoza Luis and Mendoza Ana
Home Financials for this Owner
Home Financials are based on the most recent Mortgage that was taken out on this home.
Original Mortgage
$128,937
Interest Rate
7.15%
Mortgage Type
FHA
Purchase Details
Closed on
Dec 30, 1996
Sold by
Cingire Philomena and Cingire Anthony A
Bought by
Arana Andres A and Arana Irma
Home Financials for this Owner
Home Financials are based on the most recent Mortgage that was taken out on this home.
Original Mortgage
$85,500
Interest Rate
7.46%
Create a Home Valuation Report for This Property
The Home Valuation Report is an in-depth analysis detailing your home's value as well as a comparison with similar homes in the area
Home Values in the Area
Average Home Value in this Area
Purchase History
| Date | Buyer | Sale Price | Title Company |
|---|---|---|---|
| Anticona Marleny | $252,350 | -- | |
| Mendoza Luis | $130,000 | -- | |
| Arana Andres A | $95,000 | -- |
Source: Public Records
Mortgage History
| Date | Status | Borrower | Loan Amount |
|---|---|---|---|
| Previous Owner | Anticona Marleny | $239,732 | |
| Previous Owner | Mendoza Luis | $128,937 | |
| Previous Owner | Arana Andres A | $85,500 |
Source: Public Records
Tax History Compared to Growth
Tax History
| Year | Tax Paid | Tax Assessment Tax Assessment Total Assessment is a certain percentage of the fair market value that is determined by local assessors to be the total taxable value of land and additions on the property. | Land | Improvement |
|---|---|---|---|---|
| 2025 | $11,354 | $627,900 | $277,000 | $350,900 |
| 2024 | $9,894 | $614,400 | $270,000 | $344,400 |
| 2023 | $9,894 | $128,700 | $85,500 | $43,200 |
| 2022 | $9,538 | $128,700 | $85,500 | $43,200 |
| 2021 | $9,505 | $128,700 | $85,500 | $43,200 |
| 2020 | $9,396 | $128,700 | $85,500 | $43,200 |
| 2019 | $9,142 | $128,700 | $85,500 | $43,200 |
| 2018 | $8,970 | $128,700 | $85,500 | $43,200 |
| 2017 | $8,885 | $128,700 | $85,500 | $43,200 |
| 2016 | $8,523 | $123,700 | $85,500 | $38,200 |
| 2015 | $8,060 | $123,700 | $85,500 | $38,200 |
| 2014 | $7,881 | $123,700 | $85,500 | $38,200 |
Source: Public Records
Map
Nearby Homes
- 2808 Palisade Ave
- 2615 Palisade Ave
- 209-211 Hackensack Plank Rd Unit 5B
- 214 Angelique St
- 114 32nd St Unit 30
- 315 33rd St
- 564 Hudson Ave
- 215 Jane St
- 415 26th St
- 520 28th St
- 520 27th St
- 525 28th St
- 120 32nd St Unit 2
- 544 28th St Unit 202
- 414 24th St
- 535 27th St
- 537 27th St
- 415 24th St
- 117 Hackensack Plank Rd
- 3218 Pleasant Ave