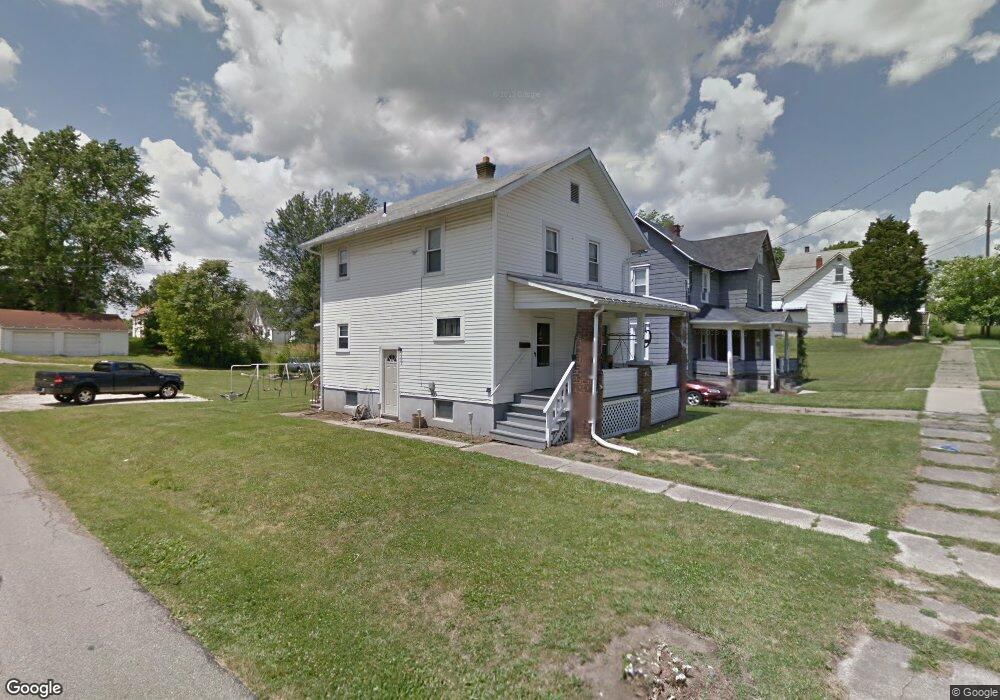
315 2nd Ave Mansfield, OH 44902
Estimated Value: $63,000 - $100,000
3
Beds
1
Bath
1,344
Sq Ft
$60/Sq Ft
Est. Value
About This Home
This home is located at 315 2nd Ave, Mansfield, OH 44902 and is currently estimated at $80,549, approximately $59 per square foot. 315 2nd Ave is a home located in Richland County with nearby schools including Goal Digital Academy, St. Peter's Elementary/Montessori School, and St. Peter's High School/Junior High.
Ownership History
Date
Name
Owned For
Owner Type
Purchase Details
Closed on
May 15, 2021
Sold by
Rental Properties Llc
Bought by
Jrm Properties Of Mansfield Llc
Current Estimated Value
Purchase Details
Closed on
Mar 8, 2018
Sold by
The Creative Property Options Llc
Bought by
Tat Rental Properties Llc
Purchase Details
Closed on
Apr 12, 2011
Sold by
Collins James L
Bought by
Creative Property Options Llc
Purchase Details
Closed on
May 10, 1993
Sold by
Collins James L Subj Life
Bought by
Collins James L
Purchase Details
Closed on
Aug 13, 1990
Create a Home Valuation Report for This Property
The Home Valuation Report is an in-depth analysis detailing your home's value as well as a comparison with similar homes in the area
Home Values in the Area
Average Home Value in this Area
Purchase History
| Date | Buyer | Sale Price | Title Company |
|---|---|---|---|
| Jrm Properties Of Mansfield Llc | $139,000 | Southern Title | |
| Tat Rental Properties Llc | $30,000 | Southern Title | |
| Creative Property Options Llc | $16,000 | Southern Title | |
| Collins James L | -- | -- | |
| -- | $5,000 | -- |
Source: Public Records
Mortgage History
| Date | Status | Borrower | Loan Amount |
|---|---|---|---|
| Closed | Tat Rental Properties Llc | $0 |
Source: Public Records
Tax History Compared to Growth
Tax History
| Year | Tax Paid | Tax Assessment Tax Assessment Total Assessment is a certain percentage of the fair market value that is determined by local assessors to be the total taxable value of land and additions on the property. | Land | Improvement |
|---|---|---|---|---|
| 2024 | $594 | $12,400 | $1,650 | $10,750 |
| 2023 | $594 | $12,400 | $1,650 | $10,750 |
| 2022 | $270 | $4,730 | $1,670 | $3,060 |
| 2021 | $272 | $4,730 | $1,670 | $3,060 |
| 2020 | $278 | $4,730 | $1,670 | $3,060 |
| 2019 | $308 | $4,730 | $1,670 | $3,060 |
| 2018 | $304 | $4,730 | $1,670 | $3,060 |
| 2017 | $296 | $4,730 | $1,670 | $3,060 |
| 2016 | $352 | $5,450 | $2,220 | $3,230 |
| 2015 | $336 | $5,450 | $2,220 | $3,230 |
| 2014 | $332 | $5,450 | $2,220 | $3,230 |
| 2012 | $131 | $5,620 | $2,290 | $3,330 |
Source: Public Records
Map
Nearby Homes