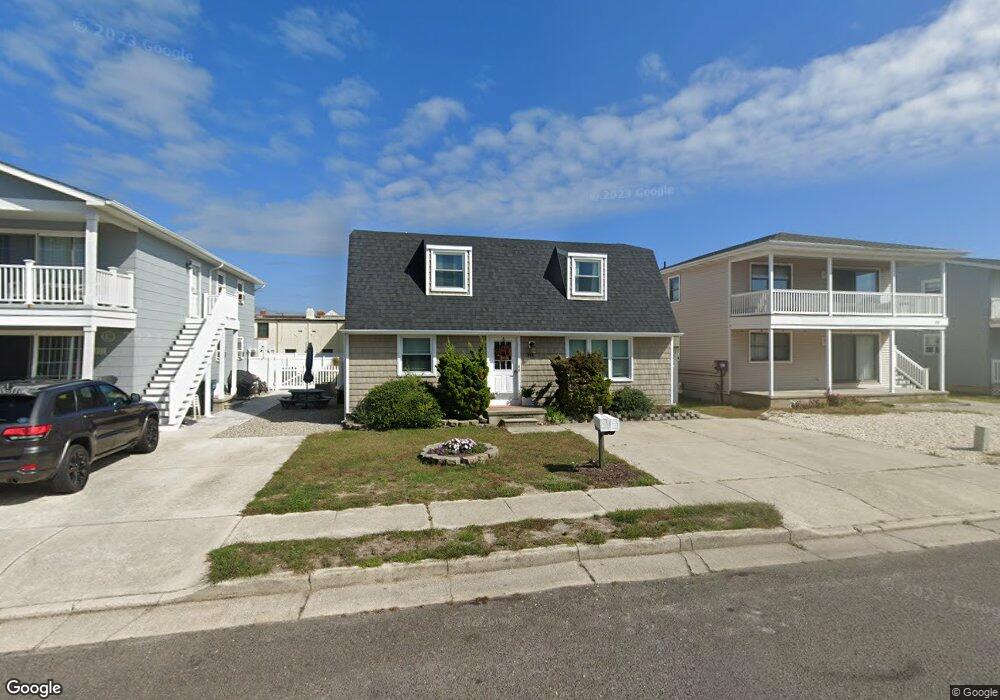
315 41st St S Unit S0 Brigantine, NJ 08203
Estimated Value: $687,282 - $792,000
Studio
--
Bath
1,680
Sq Ft
$438/Sq Ft
Est. Value
About This Home
This home is located at 315 41st St S Unit S0, Brigantine, NJ 08203 and is currently estimated at $735,571, approximately $437 per square foot. 315 41st St S Unit S0 is a home located in Atlantic County with nearby schools including Brigantine Elementary School and New Hope Christian Academy/Robinson Small Learning Center.
Ownership History
Date
Name
Owned For
Owner Type
Purchase Details
Closed on
Jan 31, 2024
Sold by
Hellman Sandra Cannon
Bought by
Cannon Sandra Ann
Current Estimated Value
Purchase Details
Closed on
Jun 19, 2006
Sold by
Connelly Robert
Bought by
Hellman Sandra and Cannon Anna
Home Financials for this Owner
Home Financials are based on the most recent Mortgage that was taken out on this home.
Original Mortgage
$440,000
Interest Rate
6.67%
Mortgage Type
Purchase Money Mortgage
Purchase Details
Closed on
Sep 14, 1999
Sold by
Stulz Joseph and Stulz Linda
Bought by
Connelly Robert P
Home Financials for this Owner
Home Financials are based on the most recent Mortgage that was taken out on this home.
Original Mortgage
$120,000
Interest Rate
8.1%
Mortgage Type
Purchase Money Mortgage
Create a Home Valuation Report for This Property
The Home Valuation Report is an in-depth analysis detailing your home's value as well as a comparison with similar homes in the area
Home Values in the Area
Average Home Value in this Area
Purchase History
| Date | Buyer | Sale Price | Title Company |
|---|---|---|---|
| Cannon Sandra Ann | -- | None Listed On Document | |
| Hellman Sandra | $550,000 | -- | |
| Connelly Robert P | $140,000 | -- |
Source: Public Records
Mortgage History
| Date | Status | Borrower | Loan Amount |
|---|---|---|---|
| Previous Owner | Hellman Sandra | $440,000 | |
| Previous Owner | Connelly Robert P | $120,000 |
Source: Public Records
Tax History
| Year | Tax Paid | Tax Assessment Tax Assessment Total Assessment is a certain percentage of the fair market value that is determined by local assessors to be the total taxable value of land and additions on the property. | Land | Improvement |
|---|---|---|---|---|
| 2025 | $6,149 | $327,100 | $255,500 | $71,600 |
| 2024 | $6,149 | $327,100 | $255,500 | $71,600 |
Source: Public Records
Map
Nearby Homes
- 314 41st St S
- 4224 W Brigantine Ave Unit 14
- 330 42nd St S Unit B20
- 323 44th St S Unit 8
- 323 44th St S Unit 103
- 323 44th St S Unit 105
- 323 44th St S Unit 2
- 134 44th St S Unit D
- 4500 W Brigantine Ave Unit 1120
- 4500 W Brigantine Ave Unit 2206
- 251 38th St S
- 245 38th St S Unit A
- 223 40th St S
- 327 36th St S Unit B
- 310 Rainbow Dr
- 8 Marc Ln
- 4540 W Brigantine Ave Unit S 105
- 4540 W Brigantine Ave Unit S109
- 4540 W Brigantine Ave Unit S 201
- 4540 W Brigantine Ave Unit 102
- 319 41st St S
- 311 41st St S Unit A
- 311 41st St S Unit 1
- 311 41st St S
- 311 41st St S
- 323 41st St S
- 4010 W Brigantine Ave
- 4006 W Brigantine Ave
- 314 40th St S
- 300 40th St S Unit A
- 300 40th St S Unit B
- 300 40th St S
- 300 40th St S
- 300 40th St S
- 300 40th St S
- 318 40th St S
- 327 41st St S
- 327 41st St S
- 327 41st St S Unit A
- 314 41st St S Unit 2
Your Personal Tour Guide
Ask me questions while you tour the home.