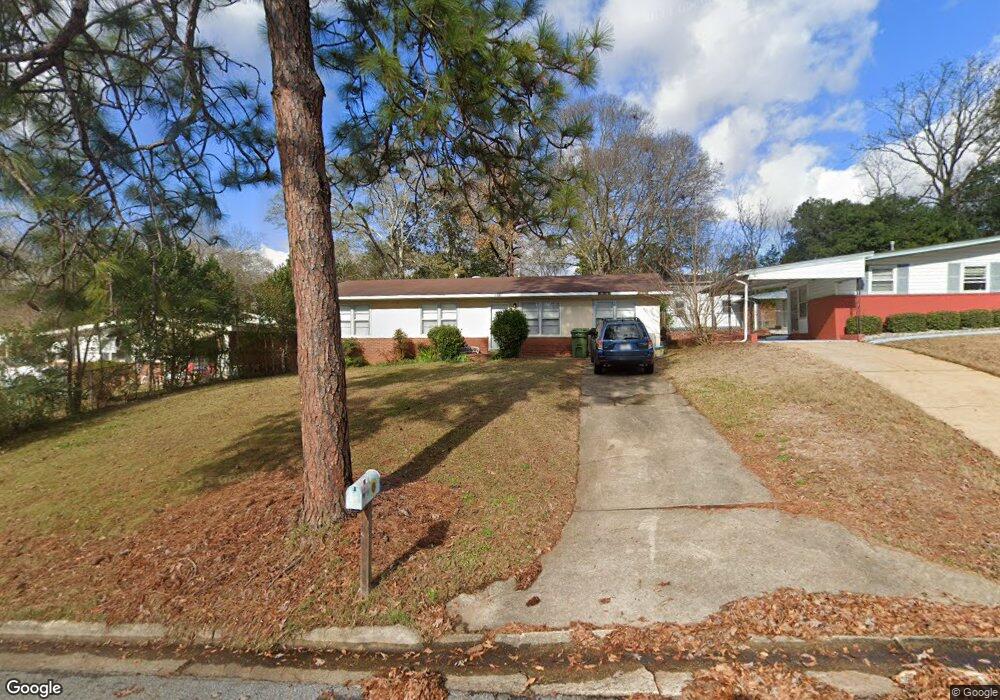
315 47th St Columbus, GA 31904
North Columbus NeighborhoodEstimated Value: $109,000 - $125,281
4
Beds
2
Baths
1,545
Sq Ft
$75/Sq Ft
Est. Value
About This Home
Property Id: 1266419
All-electric, 4 bedroom Ranch in convenient neighborhood centrally located to highways, parks and shopping. Converted carport added large bedroom and laundry. Newly painted. Shades furnished on windows. Wired for high-speed cable internet. Backyard is large and fenced, plus a generous, wired shed. Background checks required of all adults.
Ownership History
Date
Name
Owned For
Owner Type
Purchase Details
Closed on
May 31, 2017
Sold by
Lee David B
Bought by
Wood Keagan B
Current Estimated Value
Home Financials for this Owner
Home Financials are based on the most recent Mortgage that was taken out on this home.
Original Mortgage
$58,913
Outstanding Balance
$50,407
Interest Rate
5.12%
Mortgage Type
FHA
Estimated Equity
$65,413
Create a Home Valuation Report for This Property
The Home Valuation Report is an in-depth analysis detailing your home's value as well as a comparison with similar homes in the area
Home Values in the Area
Average Home Value in this Area
Purchase History
| Date | Buyer | Sale Price | Title Company |
|---|---|---|---|
| Wood Keagan B | $60,000 | -- |
Source: Public Records
Mortgage History
| Date | Status | Borrower | Loan Amount |
|---|---|---|---|
| Open | Wood Keagan B | $58,913 |
Source: Public Records
Property History
| Date | Event | Price | List to Sale | Price per Sq Ft |
|---|---|---|---|---|
| 07/23/2025 07/23/25 | Off Market | $1,300 | -- | -- |
| 07/02/2025 07/02/25 | For Rent | $1,300 | -- | -- |
Tax History
| Year | Tax Paid | Tax Assessment Tax Assessment Total Assessment is a certain percentage of the fair market value that is determined by local assessors to be the total taxable value of land and additions on the property. | Land | Improvement |
|---|---|---|---|---|
| 2025 | $1,454 | $37,148 | $9,372 | $27,776 |
| 2024 | $1,454 | $37,148 | $9,372 | $27,776 |
| 2023 | $146 | $37,148 | $9,372 | $27,776 |
| 2022 | $1,180 | $28,904 | $7,028 | $21,876 |
| 2021 | $948 | $23,212 | $7,028 | $16,184 |
| 2020 | $948 | $23,212 | $7,028 | $16,184 |
| 2019 | $951 | $23,212 | $7,028 | $16,184 |
| 2018 | $983 | $24,000 | $6,040 | $17,960 |
| 2017 | $182 | $27,788 | $7,028 | $20,760 |
| 2016 | $184 | $27,486 | $2,640 | $24,846 |
| 2015 | $74 | $27,486 | $2,640 | $24,846 |
| 2014 | $75 | $27,486 | $2,640 | $24,846 |
| 2013 | -- | $16,979 | $2,640 | $14,339 |
Source: Public Records
Map
Nearby Homes
Your Personal Tour Guide
Ask me questions while you tour the home.