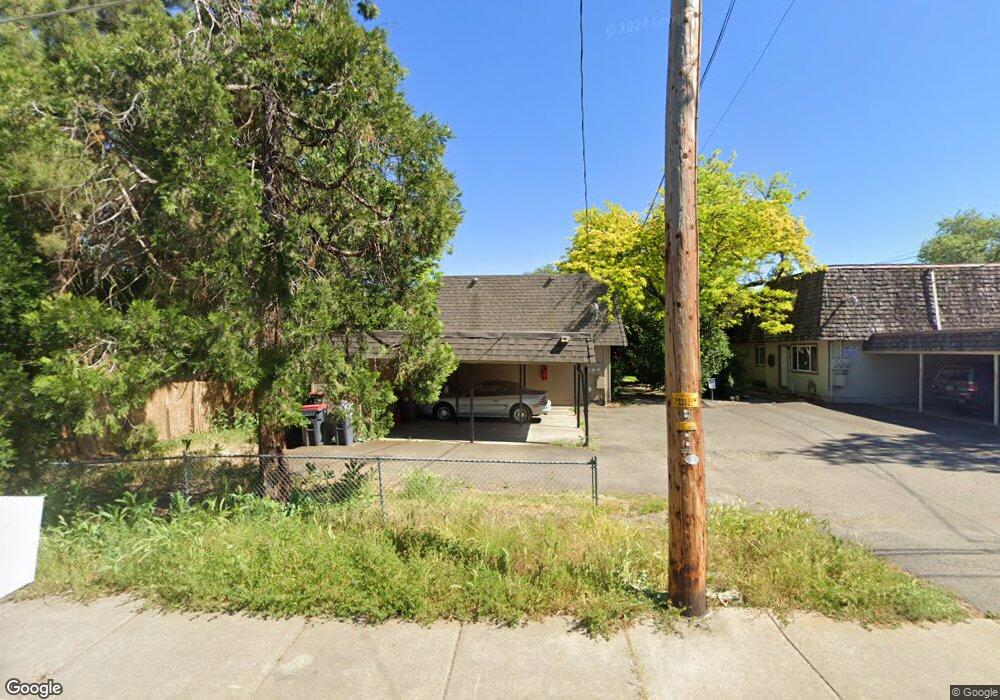
315 4th St Unit J-k-l Phoenix, OR 97535
Estimated Value: $504,000 - $620,000
--
Bed
5
Baths
2,880
Sq Ft
$198/Sq Ft
Est. Value
About This Home
This home is located at 315 4th St Unit J-k-l, Phoenix, OR 97535 and is currently estimated at $571,667, approximately $198 per square foot. 315 4th St Unit J-k-l is a home located in Jackson County with nearby schools including Phoenix Elementary School, Talent Middle School, and Phoenix High School.
Ownership History
Date
Name
Owned For
Owner Type
Purchase Details
Closed on
Jan 8, 2025
Sold by
Sellers John K and Sellers Jill S
Bought by
John And Jill Sellers Trust and Sellers
Current Estimated Value
Purchase Details
Closed on
Mar 16, 2015
Sold by
Busick Spencer and Chappelle Tony
Bought by
Sellers John K and Sellers Jill S
Home Financials for this Owner
Home Financials are based on the most recent Mortgage that was taken out on this home.
Original Mortgage
$174,000
Interest Rate
3.54%
Mortgage Type
Purchase Money Mortgage
Purchase Details
Closed on
Dec 30, 2008
Sold by
Busick Nancy Harriet
Bought by
Busick Spencer and Chappelle Tony
Purchase Details
Closed on
Dec 22, 2004
Sold by
Gibbs Rozalie S
Bought by
Gibbs Rozalie S and Frederic & Rozalie Gibbs Trust
Purchase Details
Closed on
Aug 16, 2000
Sold by
Gibbs F M Trustee Fbo
Bought by
Gibbs Frederic M and Gibbs Rozalie S
Create a Home Valuation Report for This Property
The Home Valuation Report is an in-depth analysis detailing your home's value as well as a comparison with similar homes in the area
Home Values in the Area
Average Home Value in this Area
Purchase History
| Date | Buyer | Sale Price | Title Company |
|---|---|---|---|
| John And Jill Sellers Trust | -- | First American Title | |
| Sellers John K | $160,000 | First American | |
| Busick Spencer | -- | First American Title | |
| Gibbs Rozalie S | -- | -- | |
| Gibbs Frederic M | -- | -- |
Source: Public Records
Mortgage History
| Date | Status | Borrower | Loan Amount |
|---|---|---|---|
| Previous Owner | Sellers John K | $174,000 |
Source: Public Records
Tax History Compared to Growth
Tax History
| Year | Tax Paid | Tax Assessment Tax Assessment Total Assessment is a certain percentage of the fair market value that is determined by local assessors to be the total taxable value of land and additions on the property. | Land | Improvement |
|---|---|---|---|---|
| 2025 | $4,625 | $288,440 | $49,420 | $239,020 |
| 2024 | $4,625 | $280,040 | $47,990 | $232,050 |
| 2023 | $4,480 | $271,890 | $46,600 | $225,290 |
| 2022 | $4,361 | $271,890 | $46,600 | $225,290 |
| 2021 | $4,257 | $263,980 | $45,240 | $218,740 |
| 2020 | $4,123 | $256,300 | $43,920 | $212,380 |
| 2019 | $4,014 | $241,600 | $41,400 | $200,200 |
| 2018 | $3,896 | $234,570 | $40,190 | $194,380 |
| 2017 | $3,681 | $234,570 | $40,190 | $194,380 |
| 2016 | $3,581 | $221,110 | $37,880 | $183,230 |
| 2015 | $3,441 | $221,110 | $37,880 | $183,230 |
| 2014 | $3,312 | $208,420 | $35,700 | $172,720 |
Source: Public Records
Map
Nearby Homes