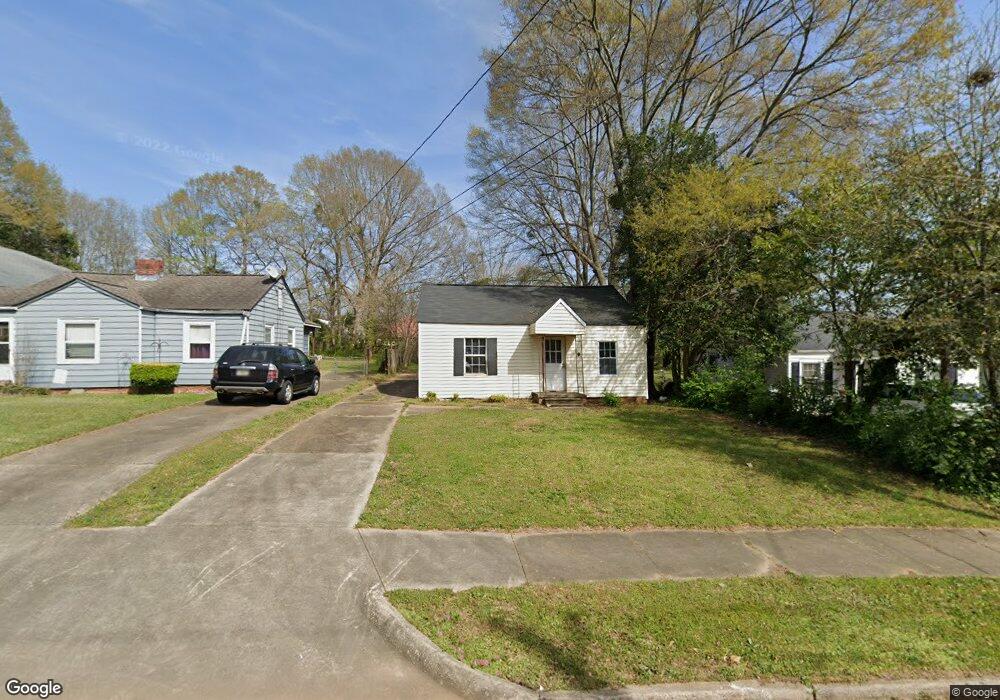
315 Alford St Lagrange, GA 30240
Estimated Value: $77,000 - $93,273
2
Beds
1
Bath
1,050
Sq Ft
$82/Sq Ft
Est. Value
About This Home
This home is located at 315 Alford St, Lagrange, GA 30240 and is currently estimated at $86,068, approximately $81 per square foot. 315 Alford St is a home located in Troup County with nearby schools including Hollis Hand Elementary School, Ethel W. Kight Elementary School, and Franklin Forest Elementary School.
Ownership History
Date
Name
Owned For
Owner Type
Purchase Details
Closed on
Jan 22, 2018
Sold by
Galyon Jeff
Bought by
Lewis Properties Of Lagrange L
Current Estimated Value
Purchase Details
Closed on
Dec 18, 2017
Sold by
Troup County Properties Ll
Bought by
Galyon Jeff
Purchase Details
Closed on
May 6, 2005
Sold by
Fling Daniel Emmett
Bought by
Davidson James E
Purchase Details
Closed on
Nov 18, 1999
Sold by
Marsha Oneal Wilson
Bought by
Fling Daniel Emmett
Purchase Details
Closed on
Aug 18, 1986
Sold by
Brogdon John and Brogdon Darlene
Bought by
Marsha Oneal Wilson
Purchase Details
Closed on
Jan 1, 1979
Sold by
Daniel Stephen D
Bought by
Brogdon John and Brogdon Darlene
Purchase Details
Closed on
Mar 13, 1978
Sold by
Blankenship
Bought by
Daniel Stephen D
Purchase Details
Closed on
May 1, 1958
Sold by
Lacount James E and Lacount Janice
Bought by
Blankenship
Create a Home Valuation Report for This Property
The Home Valuation Report is an in-depth analysis detailing your home's value as well as a comparison with similar homes in the area
Home Values in the Area
Average Home Value in this Area
Purchase History
| Date | Buyer | Sale Price | Title Company |
|---|---|---|---|
| Lewis Properties Of Lagrange L | $5,000 | -- | |
| Galyon Jeff | $100,000 | -- | |
| Davidson James E | $36,500 | -- | |
| Fling Daniel Emmett | $27,000 | -- | |
| Marsha Oneal Wilson | $29,000 | -- | |
| Brogdon John | $24,500 | -- | |
| Daniel Stephen D | -- | -- | |
| Blankenship | -- | -- |
Source: Public Records
Tax History Compared to Growth
Tax History
| Year | Tax Paid | Tax Assessment Tax Assessment Total Assessment is a certain percentage of the fair market value that is determined by local assessors to be the total taxable value of land and additions on the property. | Land | Improvement |
|---|---|---|---|---|
| 2024 | $220 | $8,052 | $3,240 | $4,812 |
| 2023 | $210 | $7,692 | $3,240 | $4,452 |
| 2022 | $208 | $7,452 | $3,240 | $4,212 |
| 2021 | $214 | $7,100 | $3,240 | $3,860 |
| 2020 | $214 | $7,100 | $3,240 | $3,860 |
| 2019 | $207 | $6,852 | $3,240 | $3,612 |
| 2018 | $84 | $6,612 | $3,000 | $3,612 |
| 2017 | $401 | $13,292 | $3,000 | $10,292 |
| 2016 | $397 | $13,163 | $3,000 | $10,163 |
| 2015 | $405 | $13,408 | $3,245 | $10,163 |
| 2014 | $390 | $12,872 | $3,245 | $9,628 |
| 2013 | -- | $14,479 | $3,240 | $11,239 |
Source: Public Records
Map
Nearby Homes