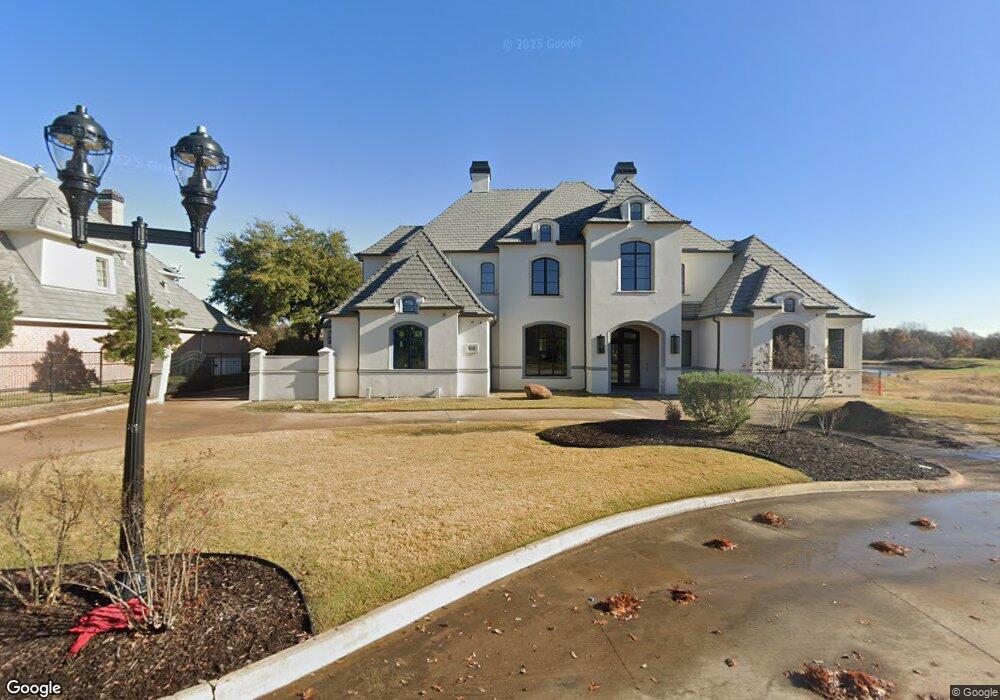
315 Augusta Ct Southlake, TX 76092
Estimated Value: $1,794,000 - $2,603,000
5
Beds
5
Baths
6,805
Sq Ft
$338/Sq Ft
Est. Value
About This Home
This home is located at 315 Augusta Ct, Southlake, TX 76092 and is currently estimated at $2,297,933, approximately $337 per square foot. 315 Augusta Ct is a home located in Tarrant County with nearby schools including Robert High Rockenbaugh Elementary School, Eubanks Intermediate School, and George Dawson Middle School.
Ownership History
Date
Name
Owned For
Owner Type
Purchase Details
Closed on
Jan 20, 2022
Sold by
Page Justice Barry
Bought by
Final Flight Insights-Justice Is Served Trust
Current Estimated Value
Purchase Details
Closed on
Jan 24, 2008
Sold by
Justice Dale
Bought by
Justice Barry
Purchase Details
Closed on
Aug 22, 2007
Sold by
Justice Barry
Bought by
Justice Dale
Purchase Details
Closed on
May 15, 1998
Sold by
Westerra Timarron Lp
Bought by
Classical Homes Inc
Purchase Details
Closed on
May 14, 1998
Sold by
Classical Homes Inc
Bought by
Justice Barry P and Justice Dale L
Create a Home Valuation Report for This Property
The Home Valuation Report is an in-depth analysis detailing your home's value as well as a comparison with similar homes in the area
Home Values in the Area
Average Home Value in this Area
Purchase History
| Date | Buyer | Sale Price | Title Company |
|---|---|---|---|
| Final Flight Insights-Justice Is Served Trust | -- | None Listed On Document | |
| Final Flight Insights-Justice Is Served Trust | -- | None Listed On Document | |
| Justice Barry | -- | None Available | |
| Justice Dale | -- | None Available | |
| Justice Barry | -- | None Available | |
| Classical Homes Inc | -- | Stewart Title | |
| Justice Barry P | -- | Stewart Title |
Source: Public Records
Mortgage History
| Date | Status | Borrower | Loan Amount |
|---|---|---|---|
| Closed | Justice Barry | $0 |
Source: Public Records
Tax History Compared to Growth
Tax History
| Year | Tax Paid | Tax Assessment Tax Assessment Total Assessment is a certain percentage of the fair market value that is determined by local assessors to be the total taxable value of land and additions on the property. | Land | Improvement |
|---|---|---|---|---|
| 2025 | $10,024 | $2,898,099 | $450,000 | $2,448,099 |
| 2024 | $11,671 | $1,662,388 | $450,000 | $1,212,388 |
| 2023 | $15,726 | $862,826 | $450,000 | $412,826 |
| 2022 | $26,935 | $1,376,427 | $300,000 | $1,076,427 |
| 2021 | $25,878 | $1,135,014 | $300,000 | $835,014 |
| 2020 | $24,707 | $1,074,869 | $300,000 | $774,869 |
| 2019 | $27,051 | $1,117,106 | $300,000 | $817,106 |
| 2018 | $18,184 | $1,017,205 | $262,500 | $754,705 |
| 2017 | $23,710 | $956,560 | $262,500 | $694,060 |
| 2016 | $22,889 | $923,442 | $262,500 | $660,942 |
| 2015 | $17,753 | $892,593 | $187,500 | $705,093 |
| 2014 | $17,753 | $816,500 | $113,750 | $702,750 |
Source: Public Records
Map
Nearby Homes
- 7312 Hix Ct
- 1227 Strathmore Dr
- 7255 Oak Alley Dr
- 608 Regency Crossing
- 1420 Kensington Ct
- 7012 Shepherds Glen
- TBD - Lot 3 John Mccain Rd
- TBD - Lot 1 John Mccain Rd
- 7200 Belle Meade Dr
- 7322 Calloway Ct
- 7316 Calloway Ct
- 1417 Nottoway Ct
- 1418 Nottoway Ct
- 1406 Nottoway Ct
- 7106 Belle Meade Dr
- 521 Regency Crossing
- 6805 Shalimar Ct
- 710 Longford Dr
- 6900 Sir Spencer Ct
- 7208 Stilton Ct
- 314 Augusta Ct
- 309 Augusta Ct
- 312 Augusta Ct
- 310 Augusta Ct
- 307 Augusta Ct
- 201 Brookview Ct
- 404 Oak Ridge Ct
- 305 Augusta Ct
- 206 Brookview Ct
- 400 Oak Ridge Ct
- 204 Brookview Ct
- 408 Oak Ridge Ct
- 202 Brookview Ct
- 303 Augusta Ct
- 1520 Bent Creek Dr
- 1510 Bent Creek Dr
- 1344 Eagle Bend
- 200 Brookview Ct
- 1530 Bent Creek Dr
- 405 Oak Ridge Ct