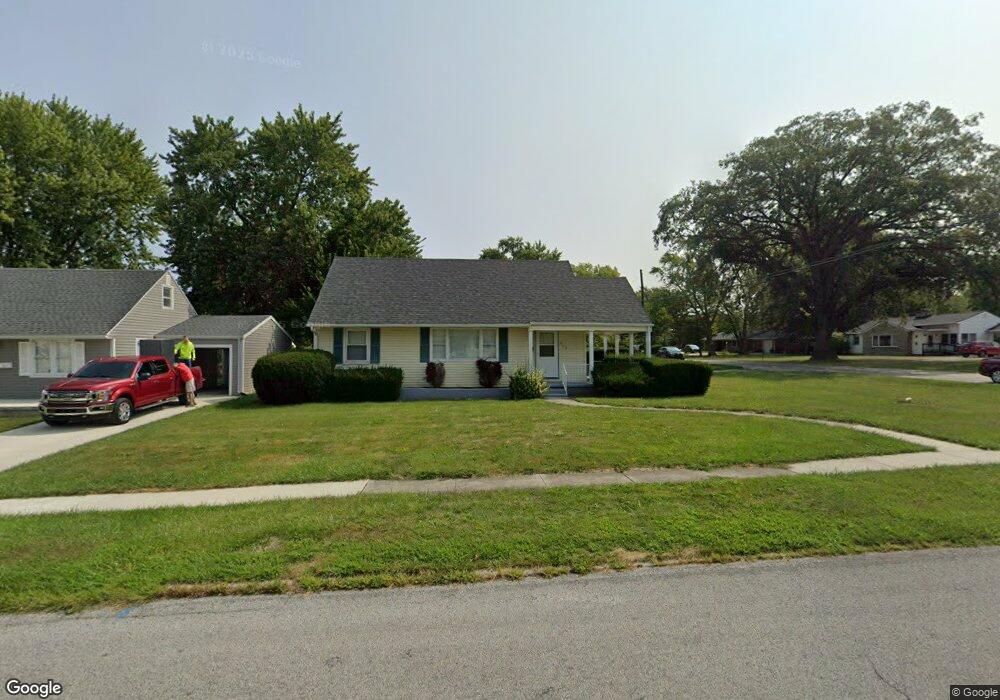
315 Blackburn Dr Lima, OH 45805
Lakewood West NeighborhoodEstimated Value: $162,000 - $178,000
4
Beds
1
Bath
1,446
Sq Ft
$117/Sq Ft
Est. Value
About This Home
This home is located at 315 Blackburn Dr, Lima, OH 45805 and is currently estimated at $169,636, approximately $117 per square foot. 315 Blackburn Dr is a home located in Allen County with nearby schools including Heritage Elementary School, Lima West Middle School, and Lima North Middle School.
Ownership History
Date
Name
Owned For
Owner Type
Purchase Details
Closed on
Apr 6, 2010
Sold by
Fleischmann Danny O and Fleischmann Christine M
Bought by
Blakely Connie M
Current Estimated Value
Home Financials for this Owner
Home Financials are based on the most recent Mortgage that was taken out on this home.
Original Mortgage
$78,296
Outstanding Balance
$52,457
Interest Rate
5.12%
Mortgage Type
FHA
Estimated Equity
$117,179
Purchase Details
Closed on
Oct 9, 2006
Sold by
Harmon Donald L and Harmon Louella
Bought by
Stout Sandra K and Fleischmann Danny O
Purchase Details
Closed on
Jul 13, 2001
Sold by
Thompson Jeremy E
Bought by
Harmon Donald L and Harmon Louella
Purchase Details
Closed on
Jun 14, 2000
Sold by
Tidd Jill A
Bought by
Thompson Jeremy E and Thompson Dawn R
Home Financials for this Owner
Home Financials are based on the most recent Mortgage that was taken out on this home.
Original Mortgage
$81,288
Interest Rate
8.31%
Mortgage Type
FHA
Purchase Details
Closed on
Sep 1, 1984
Bought by
Tidd Kevin B
Create a Home Valuation Report for This Property
The Home Valuation Report is an in-depth analysis detailing your home's value as well as a comparison with similar homes in the area
Home Values in the Area
Average Home Value in this Area
Purchase History
| Date | Buyer | Sale Price | Title Company |
|---|---|---|---|
| Blakely Connie M | $81,000 | Attorney | |
| Stout Sandra K | -- | None Available | |
| Harmon Donald L | $80,500 | -- | |
| Thompson Jeremy E | $82,000 | -- | |
| Tidd Kevin B | $39,900 | -- |
Source: Public Records
Mortgage History
| Date | Status | Borrower | Loan Amount |
|---|---|---|---|
| Open | Blakely Connie M | $78,296 | |
| Previous Owner | Thompson Jeremy E | $81,288 |
Source: Public Records
Tax History Compared to Growth
Tax History
| Year | Tax Paid | Tax Assessment Tax Assessment Total Assessment is a certain percentage of the fair market value that is determined by local assessors to be the total taxable value of land and additions on the property. | Land | Improvement |
|---|---|---|---|---|
| 2024 | $1,527 | $42,180 | $7,350 | $34,830 |
| 2023 | $1,276 | $29,720 | $5,180 | $24,540 |
| 2022 | $1,250 | $29,720 | $5,180 | $24,540 |
| 2021 | $1,318 | $29,720 | $5,180 | $24,540 |
| 2020 | $1,343 | $26,570 | $4,900 | $21,670 |
| 2019 | $1,343 | $26,570 | $4,900 | $21,670 |
| 2018 | $1,257 | $26,570 | $4,900 | $21,670 |
| 2017 | $1,208 | $23,730 | $4,900 | $18,830 |
| 2016 | $1,239 | $23,730 | $4,900 | $18,830 |
| 2015 | $1,267 | $23,730 | $4,900 | $18,830 |
| 2014 | $1,384 | $27,030 | $5,220 | $21,810 |
| 2013 | $1,346 | $27,030 | $5,220 | $21,810 |
Source: Public Records
Map
Nearby Homes
- 2700 Lowell Ave
- 704 Bentwood Dr
- 2958 Hanover Dr
- 2964 Hanover Dr
- 391 N Fernwood Dr
- 2921 Canterbury Dr
- 209 N Dale Dr
- 2050 W Market St
- 1880 Wendell Ave
- 234 S Westwood Dr
- 608 S Primrose Place
- 2925 Koop Rd
- 1912 Hillcrest Dr
- 2997 Cletus Pkwy
- N/A Eastown Rd N
- 2940 Koop Rd
- 2956 W High St
- XXXX Spencerville Rd
- 514 N Cable Rd
- 2100 University Blvd