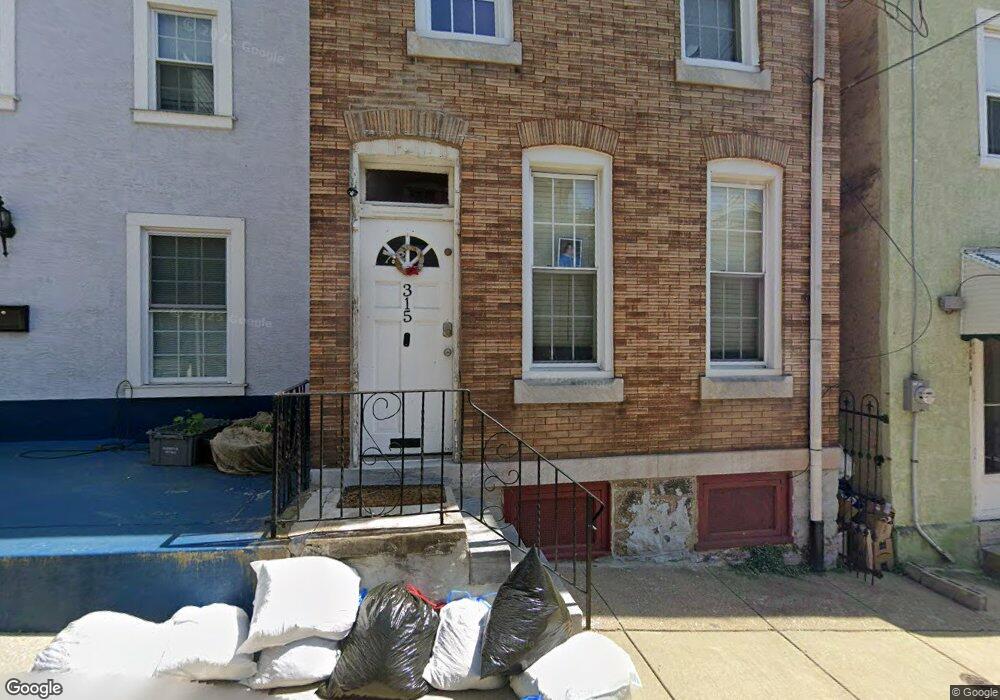
315 Carson St Philadelphia, PA 19128
Manayunk NeighborhoodEstimated Value: $283,464 - $377,000
3
Beds
1
Bath
1,240
Sq Ft
$262/Sq Ft
Est. Value
About This Home
This home is located at 315 Carson St, Philadelphia, PA 19128 and is currently estimated at $325,116, approximately $262 per square foot. 315 Carson St is a home located in Philadelphia County with nearby schools including White Oaks Elementary School, James Dobson Elementary School, and Roxborough High School.
Ownership History
Date
Name
Owned For
Owner Type
Purchase Details
Closed on
Sep 5, 2019
Sold by
Haraburda Patricia M and Haraburda H
Bought by
Bucci Rebecca Frances
Current Estimated Value
Home Financials for this Owner
Home Financials are based on the most recent Mortgage that was taken out on this home.
Original Mortgage
$161,250
Interest Rate
3.4%
Mortgage Type
New Conventional
Purchase Details
Closed on
Sep 17, 2002
Sold by
Haraburda Patricia M
Bought by
Haraburda Patricia M and Haraburda Christopher T
Purchase Details
Closed on
May 2, 2001
Sold by
Larkin Marie T and Roberts Karen B
Bought by
Haraburda Patricia M
Purchase Details
Closed on
May 11, 1994
Sold by
Culver Bernadette
Bought by
Larkin Marie T and Roberts Karen B
Create a Home Valuation Report for This Property
The Home Valuation Report is an in-depth analysis detailing your home's value as well as a comparison with similar homes in the area
Home Values in the Area
Average Home Value in this Area
Purchase History
| Date | Buyer | Sale Price | Title Company |
|---|---|---|---|
| Bucci Rebecca Frances | $215,000 | Members Settlement Sln Llc | |
| Haraburda Patricia M | -- | -- | |
| Haraburda Patricia M | -- | -- | |
| Larkin Marie T | -- | -- |
Source: Public Records
Mortgage History
| Date | Status | Borrower | Loan Amount |
|---|---|---|---|
| Previous Owner | Bucci Rebecca Frances | $161,250 |
Source: Public Records
Tax History Compared to Growth
Tax History
| Year | Tax Paid | Tax Assessment Tax Assessment Total Assessment is a certain percentage of the fair market value that is determined by local assessors to be the total taxable value of land and additions on the property. | Land | Improvement |
|---|---|---|---|---|
| 2026 | $3,351 | $258,300 | $51,600 | $206,700 |
| 2025 | $3,351 | $258,300 | $51,600 | $206,700 |
| 2024 | $3,351 | $258,300 | $51,600 | $206,700 |
| 2023 | $3,351 | $239,400 | $47,880 | $191,520 |
| 2022 | $2,188 | $194,400 | $47,880 | $146,520 |
| 2021 | $2,818 | $0 | $0 | $0 |
| 2020 | $2,818 | $0 | $0 | $0 |
| 2019 | $2,770 | $0 | $0 | $0 |
| 2018 | $2,475 | $0 | $0 | $0 |
| 2017 | $2,475 | $0 | $0 | $0 |
| 2016 | $2,055 | $0 | $0 | $0 |
| 2015 | $1,967 | $0 | $0 | $0 |
| 2014 | -- | $176,800 | $38,950 | $137,850 |
| 2012 | -- | $14,080 | $3,420 | $10,660 |
Source: Public Records
Map
Nearby Homes