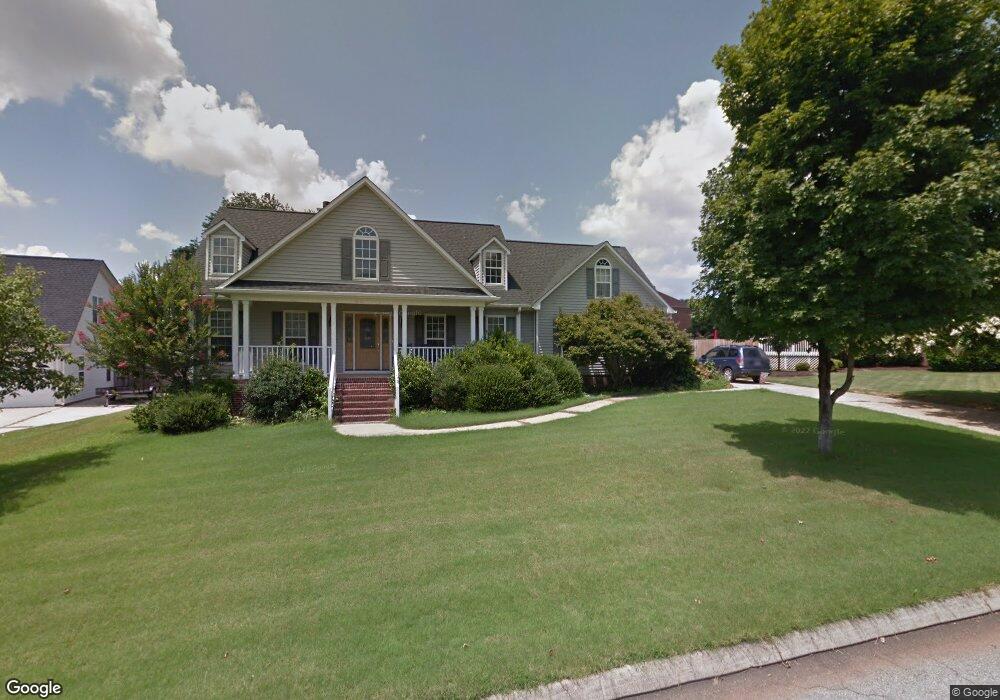
315 Clevington Way Simpsonville, SC 29681
Estimated Value: $405,607 - $500,000
3
Beds
2
Baths
2,118
Sq Ft
$213/Sq Ft
Est. Value
About This Home
This home is located at 315 Clevington Way, Simpsonville, SC 29681 and is currently estimated at $451,152, approximately $213 per square foot. 315 Clevington Way is a home located in Greenville County with nearby schools including Bethel Elementary School, Hillcrest Middle School, and Hillcrest High School.
Ownership History
Date
Name
Owned For
Owner Type
Purchase Details
Closed on
Dec 15, 2022
Sold by
Kirby Judith A
Bought by
Klinck Benjamin and Klinck Sarah
Current Estimated Value
Home Financials for this Owner
Home Financials are based on the most recent Mortgage that was taken out on this home.
Original Mortgage
$280,000
Outstanding Balance
$271,598
Interest Rate
6.95%
Mortgage Type
New Conventional
Estimated Equity
$179,554
Purchase Details
Closed on
Sep 23, 2010
Sold by
Kirby Gerald R
Bought by
Kirby Judith A
Purchase Details
Closed on
Jul 30, 2007
Sold by
Cassidy John C and Cassidy Amy E
Bought by
Kirby Judith A and Kirby Gerald R
Home Financials for this Owner
Home Financials are based on the most recent Mortgage that was taken out on this home.
Original Mortgage
$206,625
Interest Rate
6.65%
Mortgage Type
Purchase Money Mortgage
Create a Home Valuation Report for This Property
The Home Valuation Report is an in-depth analysis detailing your home's value as well as a comparison with similar homes in the area
Home Values in the Area
Average Home Value in this Area
Purchase History
| Date | Buyer | Sale Price | Title Company |
|---|---|---|---|
| Klinck Benjamin | $350,000 | South Carolina Title | |
| Kirby Judith A | -- | -- | |
| Kirby Judith A | $217,500 | None Available |
Source: Public Records
Mortgage History
| Date | Status | Borrower | Loan Amount |
|---|---|---|---|
| Open | Klinck Benjamin | $280,000 | |
| Previous Owner | Kirby Judith A | $206,625 |
Source: Public Records
Tax History Compared to Growth
Tax History
| Year | Tax Paid | Tax Assessment Tax Assessment Total Assessment is a certain percentage of the fair market value that is determined by local assessors to be the total taxable value of land and additions on the property. | Land | Improvement |
|---|---|---|---|---|
| 2024 | $2,147 | $13,670 | $1,800 | $11,870 |
| 2023 | $2,147 | $13,670 | $1,800 | $11,870 |
| 2022 | $1,489 | $9,680 | $1,800 | $7,880 |
| 2021 | $1,490 | $9,680 | $1,800 | $7,880 |
| 2020 | $1,431 | $8,840 | $1,400 | $7,440 |
| 2019 | $1,432 | $8,840 | $1,400 | $7,440 |
| 2018 | $1,484 | $8,840 | $1,400 | $7,440 |
| 2017 | $1,486 | $8,840 | $1,400 | $7,440 |
| 2016 | $1,432 | $220,880 | $35,000 | $185,880 |
| 2015 | $1,435 | $220,880 | $35,000 | $185,880 |
| 2014 | $1,394 | $226,110 | $36,000 | $190,110 |
Source: Public Records
Map
Nearby Homes
- 206 Sun Shower Way
- 104 Gilden Ln
- 409 Heather Falls Ln
- 16 Paddock Run Ln
- 204 Staffordshire Way
- 5 Bathurst Ln
- 6 Digby Place
- 341 Parkside Dr
- 108 Brown Ln
- 216 Ashcroft Ln
- 106 Scotsburn Ct
- 10 Verona Cir
- 220 Waters Run Ln
- 1 Gilder Trace
- 217 Lovelace Ct
- 120 Lavender Hill Ct Unit Site 6
- 220 Plain Post Trail
- 102 Plain Post Trail
- 106 Plain Post Trail
- 202 Plain Post Trail
- 317 Clevington Way
- 313 Clevington Way
- 204 Chenoweth Dr
- 314 Clevington Way
- 311 Clevington Way
- 300 Chenoweth Dr
- 103 Chadley Way
- 202 Chenoweth Dr
- 205 Chenoweth Dr
- 309 Clevington Way
- 105 Chadley Way
- 203 Chenoweth Dr
- 301 Chenoweth Dr
- 304 Chenoweth Dr
- 308 Clevington Way
- 201 Chenoweth Dr
- 303 Chenoweth Dr
- 307 Clevington Way
- 126 Chenoweth Dr
- 20 Summer Hill Rd