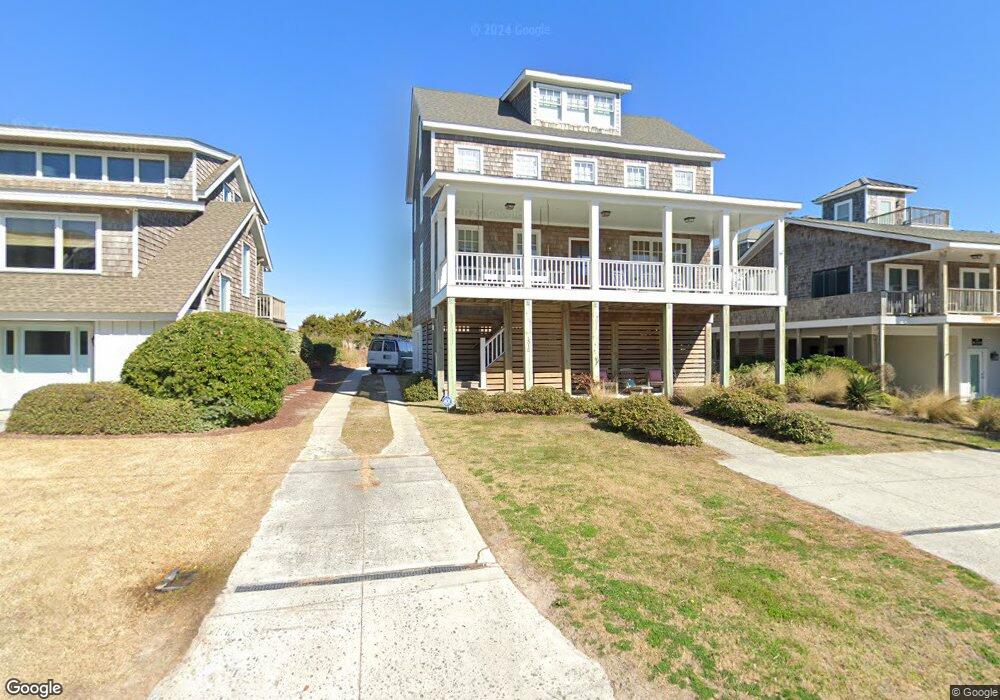
315 Club Colony Dr Atlantic Beach, NC 28512
Estimated Value: $769,000 - $1,558,000
2
Beds
1
Bath
900
Sq Ft
$1,294/Sq Ft
Est. Value
About This Home
This home is located at 315 Club Colony Dr, Atlantic Beach, NC 28512 and is currently estimated at $1,164,754, approximately $1,294 per square foot. 315 Club Colony Dr is a home located in Carteret County with nearby schools including Morehead City Primary School, Morehead Elementary School at Camp Glenn, and Morehead City Middle School.
Ownership History
Date
Name
Owned For
Owner Type
Purchase Details
Closed on
Jul 5, 2019
Sold by
Harrell W Martin and Mitchell Hannah H
Bought by
Harrell W Martin and Mitchell Hannah H
Current Estimated Value
Purchase Details
Closed on
Mar 10, 2011
Sold by
Ferrel John J and Ferrel Jennifer S
Bought by
Harrell W Martin and Mitchell Hannah H
Home Financials for this Owner
Home Financials are based on the most recent Mortgage that was taken out on this home.
Original Mortgage
$334,400
Interest Rate
4.76%
Mortgage Type
New Conventional
Purchase Details
Closed on
Jan 12, 2007
Sold by
Williams Lynwood E and Williams Kay S
Bought by
Ferrel John J and Ferrel Jennifer S
Home Financials for this Owner
Home Financials are based on the most recent Mortgage that was taken out on this home.
Original Mortgage
$642,000
Interest Rate
6.05%
Mortgage Type
Construction
Create a Home Valuation Report for This Property
The Home Valuation Report is an in-depth analysis detailing your home's value as well as a comparison with similar homes in the area
Home Values in the Area
Average Home Value in this Area
Purchase History
| Date | Buyer | Sale Price | Title Company |
|---|---|---|---|
| Harrell W Martin | $49,500 | None Available | |
| Harrell W Martin | $418,000 | None Available | |
| Ferrel John J | $800,000 | None Available |
Source: Public Records
Mortgage History
| Date | Status | Borrower | Loan Amount |
|---|---|---|---|
| Previous Owner | Harrell W Martin | $334,400 | |
| Previous Owner | Ferrel John J | $642,000 |
Source: Public Records
Tax History Compared to Growth
Tax History
| Year | Tax Paid | Tax Assessment Tax Assessment Total Assessment is a certain percentage of the fair market value that is determined by local assessors to be the total taxable value of land and additions on the property. | Land | Improvement |
|---|---|---|---|---|
| 2025 | $3,376 | $1,456,990 | $500,000 | $956,990 |
| 2024 | $2,719 | $771,000 | $345,690 | $425,310 |
| 2023 | $2,608 | $762,784 | $345,690 | $417,094 |
| 2022 | $2,532 | $762,784 | $345,690 | $417,094 |
| 2021 | $2,532 | $762,784 | $345,690 | $417,094 |
| 2020 | $2,532 | $762,784 | $345,690 | $417,094 |
| 2019 | $2,367 | $758,763 | $424,814 | $333,949 |
| 2017 | $2,367 | $758,763 | $424,814 | $333,949 |
| 2016 | $2,367 | $758,763 | $424,814 | $333,949 |
| 2015 | $2,291 | $758,763 | $424,814 | $333,949 |
| 2014 | $891 | $291,870 | $291,870 | $0 |
Source: Public Records
Map
Nearby Homes
- 106 Willis Ave Unit A
- 1116 E Fort MacOn Rd
- 203 Club Colony Dr
- 514 E Fort MacOn Rd
- 115 Island Quay Dr
- 9 E Fort MacOn Rd
- 105 Winston Ave Unit A&B
- 303 Henderson Blvd Unit 14
- 205 Barefoot Ln
- 206 Asbury Ave Unit A
- 204 Winston Ave
- 408 Caswell St Unit B
- 524 E Fort MacOn Rd
- 305 E Caswell St
- 301 Commerce Way Rd Unit 101
- 301 Commerce Way Rd Unit 127
- 301 Commerce Way Unit 252
- 301 Commerce Way Unit 258
- 301 Commerce Way Unit 101
- 301 Commerce Way Unit 260
- 313 Club Colony Dr
- 317 Club Colony Dr
- 311 Club Colony Dr
- 319 Club Colony Dr
- 310 Club Colony Dr
- 309 Club Colony Dr
- 312 Club Colony Dr
- 314 Club Colony Dr
- 318 Club Colony Dr
- 308 Club Colony Dr
- 214 Robin Ave
- 306 Club Colony Dr
- 307 Club Colony Dr
- 212 Robin Ave
- 210 Robin Ave
- 216 Robin Ave
- 304 Club Colony Dr
- 401 Club Colony Dr
- 401 Club Colony Dr Unit C
- 401 Club Colony Dr Unit B