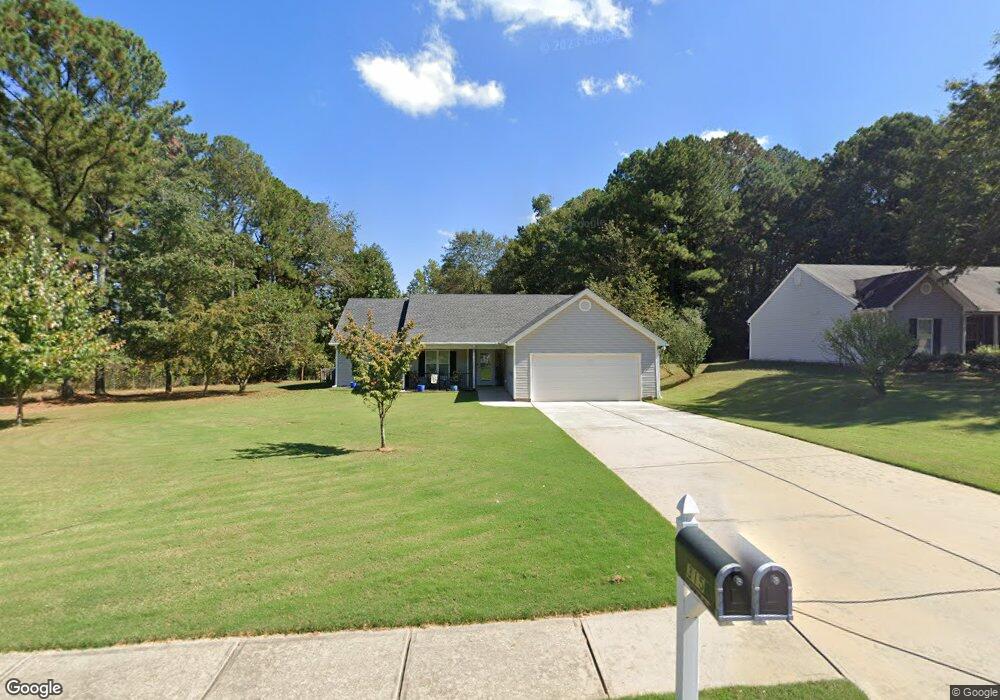
315 Comanche Trace Auburn, GA 30011
Estimated Value: $295,732 - $353,000
Studio
2
Baths
1,658
Sq Ft
$194/Sq Ft
Est. Value
About This Home
This home is located at 315 Comanche Trace, Auburn, GA 30011 and is currently estimated at $320,933, approximately $193 per square foot. 315 Comanche Trace is a home located in Barrow County with nearby schools including Auburn Elementary School, Westside Middle School, and Apalachee High School.
Ownership History
Date
Name
Owned For
Owner Type
Purchase Details
Closed on
Jul 29, 2009
Sold by
Taylor Bean & Whitaker Mtg Cor
Bought by
Azbell William F and Azbell Beverly C
Current Estimated Value
Home Financials for this Owner
Home Financials are based on the most recent Mortgage that was taken out on this home.
Original Mortgage
$118,238
Interest Rate
5.19%
Mortgage Type
Trade
Purchase Details
Closed on
Jun 3, 2008
Sold by
Ponce Ruth
Bought by
Us Bk Na
Purchase Details
Closed on
Sep 8, 2006
Sold by
Jim Prewitt Builders Inc
Bought by
Ponce Ruth
Home Financials for this Owner
Home Financials are based on the most recent Mortgage that was taken out on this home.
Original Mortgage
$29,550
Interest Rate
6.52%
Mortgage Type
New Conventional
Purchase Details
Closed on
Feb 24, 2006
Sold by
Casta Development Inc
Bought by
Jim Prewitt Builders Inc
Purchase Details
Closed on
Aug 8, 2003
Bought by
Casta Development Inc
Create a Home Valuation Report for This Property
The Home Valuation Report is an in-depth analysis detailing your home's value as well as a comparison with similar homes in the area
Home Values in the Area
Average Home Value in this Area
Purchase History
| Date | Buyer | Sale Price | Title Company |
|---|---|---|---|
| Azbell William F | $115,000 | -- | |
| Taylor Bean & Whitaker Mtg Cor | -- | -- | |
| Us Bk Na | $122,522 | -- | |
| Us Bank National Association | -- | -- | |
| Ponce Ruth | $148,000 | -- | |
| Ponce Ruth | $147,900 | -- | |
| Jim Prewitt Builders Inc | $42,000 | -- | |
| Casta Development Inc | -- | -- |
Source: Public Records
Mortgage History
| Date | Status | Borrower | Loan Amount |
|---|---|---|---|
| Closed | Taylor Bean & Whitaker Mtg Cor | $118,238 | |
| Previous Owner | Ponce Ruth | $29,550 | |
| Previous Owner | Ponce Ruth | $118,300 |
Source: Public Records
Tax History
| Year | Tax Paid | Tax Assessment Tax Assessment Total Assessment is a certain percentage of the fair market value that is determined by local assessors to be the total taxable value of land and additions on the property. | Land | Improvement |
|---|---|---|---|---|
| 2025 | $1,429 | $100,772 | $20,000 | $80,772 |
| 2024 | $1,702 | $100,772 | $20,000 | $80,772 |
| 2023 | $1,866 | $100,772 | $20,000 | $80,772 |
| 2022 | $911 | $84,944 | $20,000 | $64,944 |
| 2021 | $758 | $72,616 | $16,000 | $56,616 |
| 2020 | $674 | $66,452 | $14,000 | $52,452 |
| 2019 | $699 | $66,452 | $14,000 | $52,452 |
| 2018 | $708 | $58,206 | $12,000 | $46,206 |
| 2017 | $258 | $48,311 | $11,200 | $37,111 |
| 2016 | $474 | $42,674 | $10,000 | $32,674 |
| 2015 | $481 | $43,024 | $10,000 | $33,024 |
| 2014 | $1,140 | $41,607 | $8,232 | $33,375 |
| 2013 | -- | $39,951 | $8,232 | $31,719 |
Source: Public Records
Map
Nearby Homes
- 121 Mount Moriah Rd
- 328 Carter Rd Unit 106
- 102 Mount Moriah Rd
- 120 Mount Moriah Rd
- 57 Longhorn Way
- 29 Hydrangea Unit 72 Way
- 42 Avian Way
- 42 Avian Way Unit 128B
- 51 Way
- 46 Mount Moriah Rd
- 44 County Line-Auburn Rd Unit R
- 44 County Line-Auburn Rd
- 1277 4th Ave
- 1269 4th Ave
- 1630 Branthaven Ln
- 5899 Wheeler Ridge Rd
- 51 Little Magnolia Ln
- 79 Arnold Poplar Ln
- 518 Vinemont Way
- 41 Hydrangea Ln Unit 73
- 313 Comanche Trace
- 313 Comanche Trace Unit 39
- 314 Comanche Trace
- 247 Cheyenne Way
- 312 Comanche Trace
- 245 Cheyenne Way
- 316 Comanche Trace
- 318 Comanche Trace
- 243 Cheyenne Way
- 310 Comanche Trace
- 246 Cheyenne Way
- 241 Cheyenne Way
- 241 Cheyenne Way Unit A/43
- 999 Parks Mill Rd
- 46 Parks Mill Rd
- 255 Cheyenne Way
- 248 Cheyenne Way
- 242 Cheyenne Way
- 244 Cheyenne Way
- 250 Cheyenne Way
Your Personal Tour Guide
Ask me questions while you tour the home.