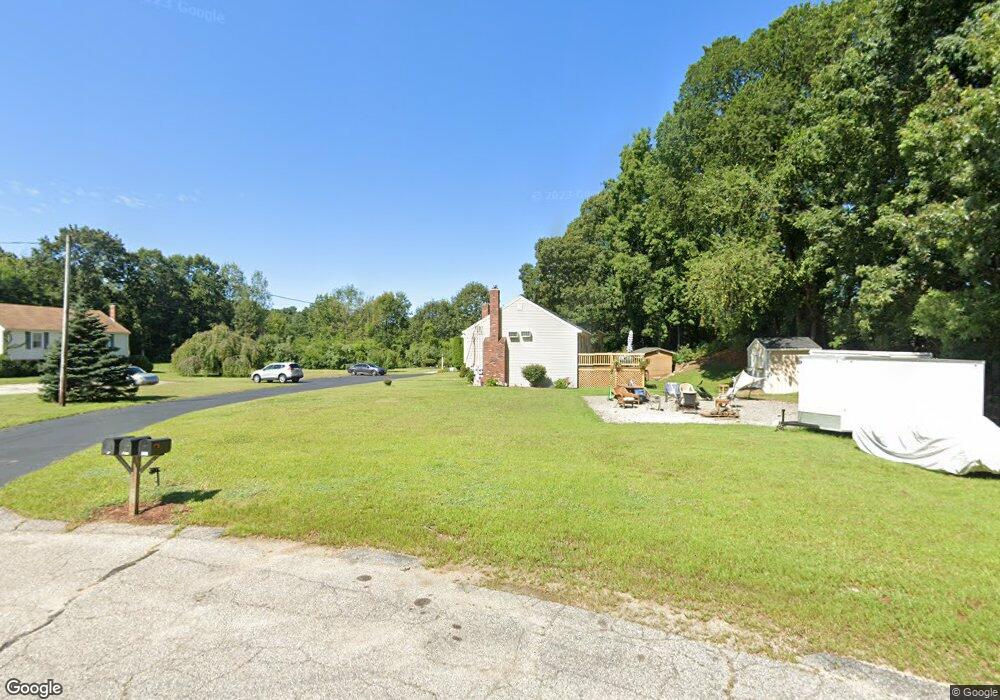
315 Cowell Rd Wrentham, MA 02093
Estimated Value: $391,000 - $431,000
2
Beds
2
Baths
1,631
Sq Ft
$248/Sq Ft
Est. Value
About This Home
This home is located at 315 Cowell Rd, Wrentham, MA 02093 and is currently estimated at $403,798, approximately $247 per square foot. 315 Cowell Rd is a home located in Norfolk County with nearby schools including Delaney Elementary School, Charles E Roderick, and The Sage School.
Ownership History
Date
Name
Owned For
Owner Type
Purchase Details
Closed on
Feb 23, 2007
Sold by
Anderson Mark C
Bought by
Monroe Jane M
Current Estimated Value
Home Financials for this Owner
Home Financials are based on the most recent Mortgage that was taken out on this home.
Original Mortgage
$203,200
Outstanding Balance
$121,567
Interest Rate
6.23%
Mortgage Type
Purchase Money Mortgage
Estimated Equity
$282,231
Purchase Details
Closed on
Jul 26, 2001
Sold by
Joanis Steven C
Bought by
Anderson Mark C
Home Financials for this Owner
Home Financials are based on the most recent Mortgage that was taken out on this home.
Original Mortgage
$132,800
Interest Rate
7.18%
Mortgage Type
Purchase Money Mortgage
Purchase Details
Closed on
May 13, 1997
Sold by
Warren Arthur F and Warren Judith G
Bought by
Joanis Steven C
Home Financials for this Owner
Home Financials are based on the most recent Mortgage that was taken out on this home.
Original Mortgage
$91,200
Interest Rate
7.88%
Mortgage Type
Purchase Money Mortgage
Create a Home Valuation Report for This Property
The Home Valuation Report is an in-depth analysis detailing your home's value as well as a comparison with similar homes in the area
Home Values in the Area
Average Home Value in this Area
Purchase History
| Date | Buyer | Sale Price | Title Company |
|---|---|---|---|
| Monroe Jane M | $254,000 | -- | |
| Anderson Mark C | $166,000 | -- | |
| Joanis Steven C | $96,000 | -- |
Source: Public Records
Mortgage History
| Date | Status | Borrower | Loan Amount |
|---|---|---|---|
| Open | Monroe Jane M | $203,200 | |
| Closed | Monroe Jane M | $25,400 | |
| Previous Owner | Joanis Steven C | $132,800 | |
| Previous Owner | Joanis Steven C | $122,700 | |
| Previous Owner | Joanis Steven C | $91,200 |
Source: Public Records
Tax History Compared to Growth
Tax History
| Year | Tax Paid | Tax Assessment Tax Assessment Total Assessment is a certain percentage of the fair market value that is determined by local assessors to be the total taxable value of land and additions on the property. | Land | Improvement |
|---|---|---|---|---|
| 2025 | $3,552 | $306,500 | $0 | $306,500 |
| 2024 | $3,678 | $306,500 | $0 | $306,500 |
| 2023 | $3,994 | $316,500 | $0 | $316,500 |
| 2022 | $3,590 | $262,600 | $0 | $262,600 |
| 2021 | $3,626 | $257,700 | $0 | $257,700 |
| 2020 | $3,199 | $224,500 | $0 | $224,500 |
| 2019 | $3,249 | $230,100 | $0 | $230,100 |
| 2018 | $3,015 | $211,700 | $0 | $211,700 |
| 2017 | $2,938 | $206,200 | $0 | $206,200 |
| 2016 | $2,836 | $198,600 | $0 | $198,600 |
| 2015 | $2,690 | $179,600 | $0 | $179,600 |
| 2014 | $2,779 | $181,500 | $0 | $181,500 |
Source: Public Records
Map
Nearby Homes
- 362 East St
- 65 Pond St
- 1 Lorraine Metcalf Dr
- 120 Hawes St
- 319 Taunton St
- 270 Dedham St
- 483 Thurston St
- 10 Nature View Dr
- 15 Nature View Dr
- 11 Earle Stewart Ln
- 131 Creek St Unit 7
- Lot 3 - 14 Earle Stewart Ln
- Lot 1 - Blueberry 2 Car Plan at King Philip Estates
- Lot 8 - Blueberry 2 Car Plan at King Philip Estates
- Lot 5 - Hughes 2 car Plan at King Philip Estates
- Lot 6 - Blueberry 3 Car Plan at King Philip Estates
- Lot 2 - Camden 2 Car Plan at King Philip Estates
- Lot 7 - Cedar Plan at King Philip Estates
- Lot 4 - Hemingway 2 Car Plan at King Philip Estates
- Lot 3 - Blueberry 2 Car Plan at King Philip Estates
- 325 Cowell Rd
- 305 Cowell Rd
- 305 Cowell Rd Unit A
- 315 Cowell Rd Unit 315
- 315 Cowell Rd Unit 2,m25
- 275 Cowell Rd
- 285 Cowell Rd
- 295 Cowell Rd
- 295 Cowell Rd Unit 3
- 285 Cowell Rd Unit B
- 148 Thurston St
- 255 Cowell Rd
- 245 Cowell Rd
- 255 Cowell Rd Unit b
- 10 Cobb Rd
- 10 Cobb Rd Unit 10
- 30 Cobb Rd
- 265 Cowell Rd
- 40 Cobb Rd
- 50 Cobb Rd