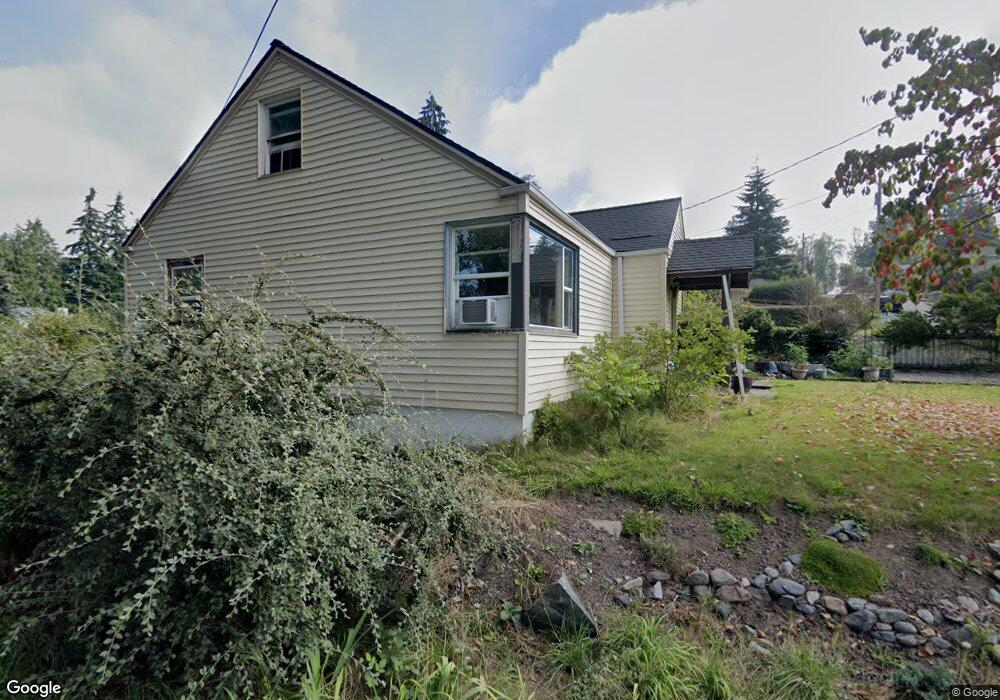
315 E Spruce St Mount Vernon, WA 98273
Estimated Value: $424,000 - $467,000
4
Beds
1
Bath
1,196
Sq Ft
$372/Sq Ft
Est. Value
About This Home
This home is located at 315 E Spruce St, Mount Vernon, WA 98273 and is currently estimated at $444,697, approximately $371 per square foot. 315 E Spruce St is a home located in Skagit County with nearby schools including Madison Elementary School, Mount Baker Middle School, and Mount Vernon High School.
Ownership History
Date
Name
Owned For
Owner Type
Purchase Details
Closed on
Aug 22, 2016
Sold by
Underdahl Josh
Bought by
Frey Layla
Current Estimated Value
Home Financials for this Owner
Home Financials are based on the most recent Mortgage that was taken out on this home.
Original Mortgage
$133,000
Outstanding Balance
$105,623
Interest Rate
3.42%
Estimated Equity
$339,074
Purchase Details
Closed on
Nov 15, 2011
Sold by
Goodloe Sean and Goodloe Kelli
Bought by
Frey Layla and Underdahl Josh
Home Financials for this Owner
Home Financials are based on the most recent Mortgage that was taken out on this home.
Original Mortgage
$99,000
Interest Rate
4.06%
Purchase Details
Closed on
Jan 13, 2005
Sold by
Hottell Erin and Hottell Jason
Bought by
Goodloe Sean and Goodloe Kelli
Home Financials for this Owner
Home Financials are based on the most recent Mortgage that was taken out on this home.
Original Mortgage
$133,400
Interest Rate
5.37%
Create a Home Valuation Report for This Property
The Home Valuation Report is an in-depth analysis detailing your home's value as well as a comparison with similar homes in the area
Home Values in the Area
Average Home Value in this Area
Purchase History
| Date | Buyer | Sale Price | Title Company |
|---|---|---|---|
| Frey Layla | $82,660 | Land Title & Escrow | |
| Frey Layla | $110,280 | First American Title Ins Co | |
| Goodloe Sean | $166,741 | Stewart Title Of Snohomish C |
Source: Public Records
Mortgage History
| Date | Status | Borrower | Loan Amount |
|---|---|---|---|
| Open | Frey Layla | $133,000 | |
| Previous Owner | Frey Layla | $99,000 | |
| Previous Owner | Goodloe Sean | $133,400 | |
| Closed | Goodloe Sean | $33,350 |
Source: Public Records
Tax History
| Year | Tax Paid | Tax Assessment Tax Assessment Total Assessment is a certain percentage of the fair market value that is determined by local assessors to be the total taxable value of land and additions on the property. | Land | Improvement |
|---|---|---|---|---|
| 2025 | $4,232 | $399,700 | $236,900 | $162,800 |
| 2024 | $3,589 | $399,600 | $240,400 | $159,200 |
| 2023 | $3,589 | $350,800 | $210,500 | $140,300 |
| 2022 | $3,151 | $361,800 | $212,800 | $149,000 |
| 2021 | $3,104 | $268,400 | $139,700 | $128,700 |
| 2020 | $2,979 | $246,000 | $0 | $0 |
| 2019 | $2,465 | $229,500 | $0 | $0 |
| 2018 | $2,868 | $215,300 | $0 | $0 |
| 2017 | $2,532 | $192,800 | $0 | $0 |
| 2016 | $2,241 | $171,700 | $73,200 | $98,500 |
| 2015 | $2,100 | $150,500 | $64,200 | $86,300 |
| 2013 | $2,090 | $135,900 | $0 | $0 |
Source: Public Records
Map
Nearby Homes
- 603 N 8th St
- 1024 N 8th St
- 218 Evergreen St
- 520 N 1st St
- 1211 N 8th St Unit 2
- 0 NHN William Way Unit 85&86
- 310 S 11th St Unit 212
- 310 S 11th St Unit 204
- 122 S Baker St
- 303 S Baker St
- 3536 Jay Way
- 2012 E Belair Dr
- 2027 E Belair Dr
- 18373 Lincoln St
- 0 N 18th St
- 904 Garfield St
- 130 Stanford Dr
- 325 N 21st St
- 110 Stanford Dr
- 225 N 21st St
Your Personal Tour Guide
Ask me questions while you tour the home.