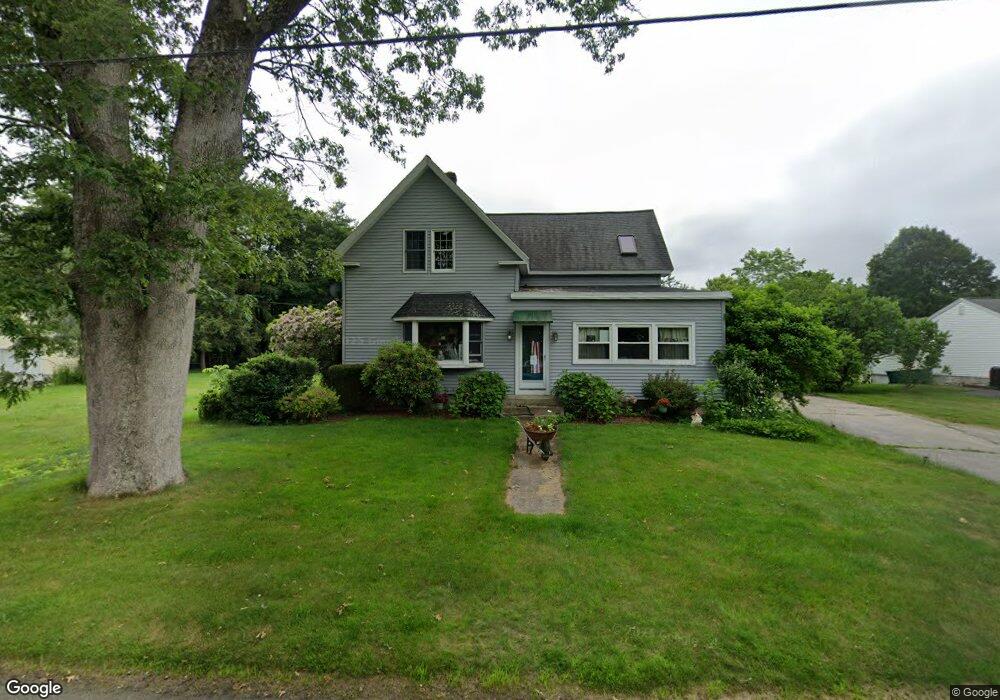
315 Elm Terrace Mansfield, MA 02048
Estimated Value: $617,000 - $691,000
4
Beds
3
Baths
1,809
Sq Ft
$362/Sq Ft
Est. Value
About This Home
This home is located at 315 Elm Terrace, Mansfield, MA 02048 and is currently estimated at $654,858, approximately $362 per square foot. 315 Elm Terrace is a home located in Bristol County with nearby schools including Everett W. Robinson Elementary School, Jordan/Jackson Elementary School, and Harold L. Qualters Middle School.
Ownership History
Date
Name
Owned For
Owner Type
Purchase Details
Closed on
Aug 30, 2023
Sold by
Najaar Gerald A
Bought by
Najjar Alison M and Najjar Gerald A
Current Estimated Value
Create a Home Valuation Report for This Property
The Home Valuation Report is an in-depth analysis detailing your home's value as well as a comparison with similar homes in the area
Home Values in the Area
Average Home Value in this Area
Purchase History
| Date | Buyer | Sale Price | Title Company |
|---|---|---|---|
| Najjar Alison M | -- | None Available |
Source: Public Records
Tax History Compared to Growth
Tax History
| Year | Tax Paid | Tax Assessment Tax Assessment Total Assessment is a certain percentage of the fair market value that is determined by local assessors to be the total taxable value of land and additions on the property. | Land | Improvement |
|---|---|---|---|---|
| 2025 | $7,982 | $606,100 | $297,500 | $308,600 |
| 2024 | $7,881 | $583,800 | $284,800 | $299,000 |
| 2023 | $7,664 | $543,900 | $284,800 | $259,100 |
| 2022 | $7,599 | $500,900 | $265,100 | $235,800 |
| 2021 | $7,455 | $463,100 | $249,900 | $213,200 |
| 2020 | $6,247 | $406,700 | $220,600 | $186,100 |
| 2019 | $4,626 | $420,300 | $210,700 | $209,600 |
| 2018 | $6,265 | $402,400 | $201,800 | $200,600 |
| 2017 | $6,856 | $393,500 | $196,600 | $196,900 |
| 2016 | $5,620 | $364,700 | $187,700 | $177,000 |
| 2015 | $5,428 | $350,200 | $187,700 | $162,500 |
Source: Public Records
Map
Nearby Homes
- 176 Elm St
- 2 Oak St Unit 2D
- 2 Oak St Unit 2A
- 2 Oak St Unit 2C
- 2 Oak St Unit 2B
- 4 Buckskin Dr
- 37 Oakleaf Dr
- 451R Gilbert St
- 150 Gilbert St
- 9 Larson Farm Dr
- 47 Old Farm Rd
- 250 Mansfield Ave Unit 66
- 14 Country Club Way
- 50 Kimberly Dr
- 15 Reservoir St Unit 44
- 24 Maverick Dr
- 231 Spring St
- 157 Mansfield Ave Unit 14
- 18 Columbine Rd
- 450 West St