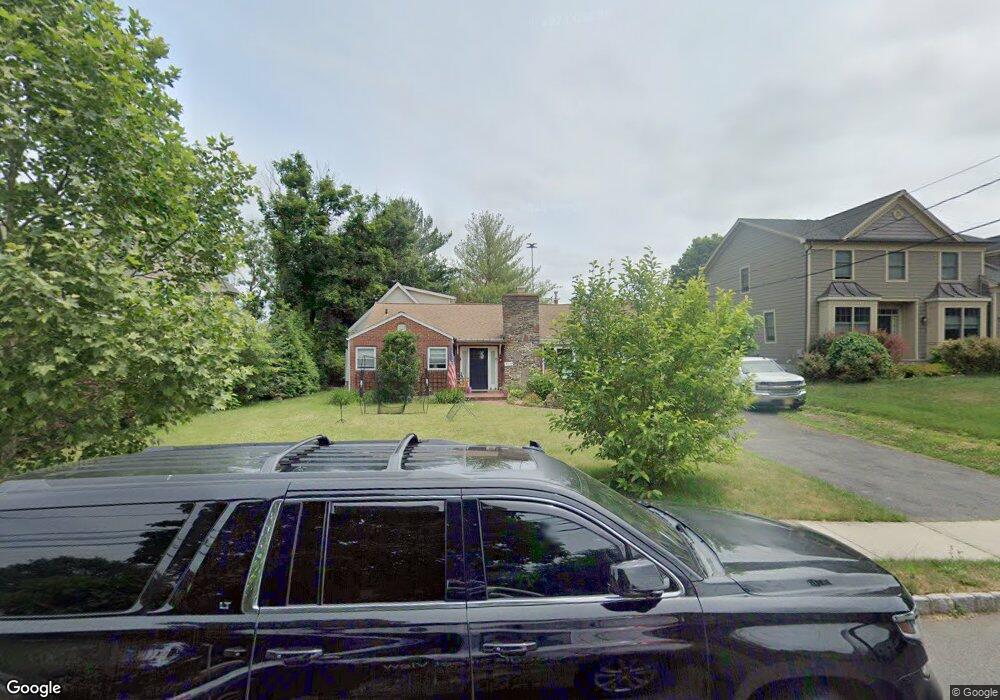
315 Ewing St Princeton, NJ 08540
Estimated Value: $852,974 - $1,087,000
2
Beds
1
Bath
1,702
Sq Ft
$564/Sq Ft
Est. Value
About This Home
This home is located at 315 Ewing St, Princeton, NJ 08540 and is currently estimated at $959,244, approximately $563 per square foot. 315 Ewing St is a home located in Mercer County with nearby schools including Community Park Elementary School, Princeton Middle School, and Princeton High School.
Ownership History
Date
Name
Owned For
Owner Type
Purchase Details
Closed on
Dec 10, 2018
Sold by
Brown Alexander
Bought by
Brown Alexander and Yam Carol
Current Estimated Value
Home Financials for this Owner
Home Financials are based on the most recent Mortgage that was taken out on this home.
Original Mortgage
$421,000
Outstanding Balance
$371,650
Interest Rate
4.9%
Mortgage Type
New Conventional
Estimated Equity
$587,594
Purchase Details
Closed on
Dec 22, 2014
Sold by
Carnevale Livia
Bought by
Brown Alexander and Babbitt Kelly
Home Financials for this Owner
Home Financials are based on the most recent Mortgage that was taken out on this home.
Original Mortgage
$360,000
Interest Rate
4.02%
Mortgage Type
New Conventional
Create a Home Valuation Report for This Property
The Home Valuation Report is an in-depth analysis detailing your home's value as well as a comparison with similar homes in the area
Home Values in the Area
Average Home Value in this Area
Purchase History
| Date | Buyer | Sale Price | Title Company |
|---|---|---|---|
| Brown Alexander | -- | American Home Title Llc | |
| Brown Alexander | $100,000 | American Home Title Llc | |
| Brown Alexander | $450,000 | Monarch Title Agency Inc |
Source: Public Records
Mortgage History
| Date | Status | Borrower | Loan Amount |
|---|---|---|---|
| Open | Brown Alexander | $421,000 | |
| Previous Owner | Brown Alexander | $360,000 |
Source: Public Records
Tax History Compared to Growth
Tax History
| Year | Tax Paid | Tax Assessment Tax Assessment Total Assessment is a certain percentage of the fair market value that is determined by local assessors to be the total taxable value of land and additions on the property. | Land | Improvement |
|---|---|---|---|---|
| 2025 | $12,556 | $471,500 | $342,000 | $129,500 |
| 2024 | $11,854 | $471,500 | $342,000 | $129,500 |
| 2023 | $11,854 | $471,500 | $342,000 | $129,500 |
| 2022 | $11,467 | $471,500 | $342,000 | $129,500 |
| 2021 | $11,500 | $471,500 | $342,000 | $129,500 |
| 2020 | $11,410 | $471,500 | $342,000 | $129,500 |
| 2019 | $11,184 | $471,500 | $342,000 | $129,500 |
| 2018 | $8,736 | $374,600 | $302,000 | $72,600 |
| 2017 | $8,616 | $374,600 | $302,000 | $72,600 |
| 2016 | $8,481 | $374,600 | $302,000 | $72,600 |
| 2015 | $8,286 | $374,600 | $302,000 | $72,600 |
| 2014 | $8,185 | $374,600 | $302,000 | $72,600 |
Source: Public Records
Map
Nearby Homes
- 174 Linden Ln
- 380 Franklin Ave
- 261 Moore St
- 189 Moore St
- 201 Grover Ave
- 16 Cameron Ct
- 267 Hamilton Ave
- 433 Walnut Ln
- 3 Harris Rd
- 22 Gordon Way
- 75 Clover Ln
- 150 Leabrook Ln
- 57 Moran Ave
- 22 Valley Rd
- 36 Moore St Unit 6
- 8 Governors Ln
- 576 Ewing St
- 1 Markham Rd Unit 2C
- 1 Markham Rd Unit 1D
- 428 Nassau St