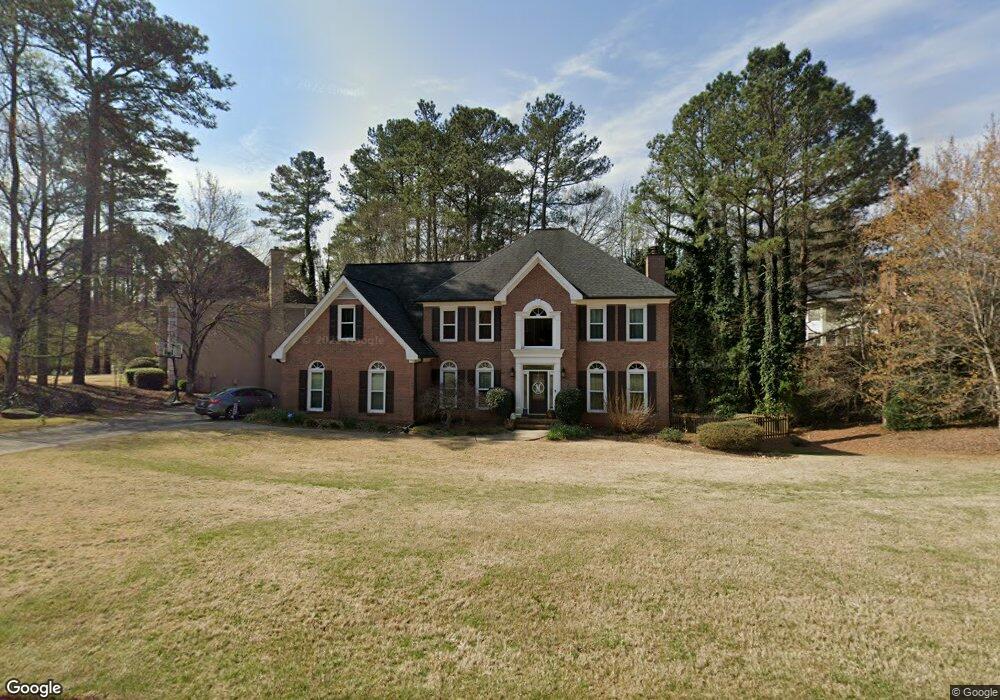
315 Fernly Park Dr Alpharetta, GA 30022
Doublegate NeighborhoodEstimated Value: $956,000 - $1,143,000
5
Beds
5
Baths
3,212
Sq Ft
$328/Sq Ft
Est. Value
About This Home
This home is located at 315 Fernly Park Dr, Alpharetta, GA 30022 and is currently estimated at $1,053,587, approximately $328 per square foot. 315 Fernly Park Dr is a home located in Fulton County with nearby schools including State Bridge Crossing Elementary School, Autrey Mill Middle School, and Johns Creek High School.
Ownership History
Date
Name
Owned For
Owner Type
Purchase Details
Closed on
Jun 7, 2011
Sold by
Bishop J Conrad and Bishop Arlene
Bought by
Mills Damon R and Mills Gabrielle M
Current Estimated Value
Home Financials for this Owner
Home Financials are based on the most recent Mortgage that was taken out on this home.
Original Mortgage
$350,000
Outstanding Balance
$241,169
Interest Rate
4.62%
Mortgage Type
New Conventional
Estimated Equity
$812,418
Purchase Details
Closed on
Mar 17, 1995
Sold by
Bliss Ronald G Linda D
Bought by
Bishop J Conrad Arlene
Purchase Details
Closed on
Nov 30, 1993
Sold by
Fidziura Mitchell B Patrici
Bought by
Bliss Ronald G
Home Financials for this Owner
Home Financials are based on the most recent Mortgage that was taken out on this home.
Original Mortgage
$240,000
Interest Rate
7.13%
Purchase Details
Closed on
Feb 26, 1993
Sold by
Brown Rudy A Sons Inc
Bought by
Fidziura Mitchell B Patrici
Home Financials for this Owner
Home Financials are based on the most recent Mortgage that was taken out on this home.
Original Mortgage
$165,000
Interest Rate
8.06%
Create a Home Valuation Report for This Property
The Home Valuation Report is an in-depth analysis detailing your home's value as well as a comparison with similar homes in the area
Home Values in the Area
Average Home Value in this Area
Purchase History
| Date | Buyer | Sale Price | Title Company |
|---|---|---|---|
| Mills Damon R | $450,000 | -- | |
| Bishop J Conrad Arlene | $305,000 | -- | |
| Bliss Ronald G | $273,000 | -- | |
| Fidziura Mitchell B Patrici | $283,400 | -- |
Source: Public Records
Mortgage History
| Date | Status | Borrower | Loan Amount |
|---|---|---|---|
| Open | Mills Damon R | $350,000 | |
| Previous Owner | Bliss Ronald G | $240,000 | |
| Previous Owner | Fidziura Mitchell B Patrici | $165,000 | |
| Closed | Bishop J Conrad Arlene | $0 |
Source: Public Records
Tax History Compared to Growth
Tax History
| Year | Tax Paid | Tax Assessment Tax Assessment Total Assessment is a certain percentage of the fair market value that is determined by local assessors to be the total taxable value of land and additions on the property. | Land | Improvement |
|---|---|---|---|---|
| 2025 | $6,147 | $385,240 | $115,600 | $269,640 |
| 2023 | $7,977 | $282,600 | $50,800 | $231,800 |
| 2022 | $5,880 | $261,520 | $45,280 | $216,240 |
| 2021 | $5,825 | $220,960 | $47,320 | $173,640 |
| 2020 | $5,863 | $207,880 | $52,160 | $155,720 |
| 2019 | $690 | $188,520 | $47,040 | $141,480 |
| 2018 | $5,586 | $184,120 | $45,960 | $138,160 |
| 2017 | $5,802 | $184,120 | $45,960 | $138,160 |
| 2016 | $5,757 | $187,240 | $39,160 | $148,080 |
| 2015 | $5,819 | $187,240 | $39,160 | $148,080 |
| 2014 | $5,461 | $167,880 | $33,360 | $134,520 |
Source: Public Records
Map
Nearby Homes
- 230 Skidaway Ct
- 10281 Midway Ave
- 10265 Minion Ct Unit 27
- 10296 Quadrant Ct Unit 76
- 510 Winston Croft Cir Unit 56
- 504 Winston Croft Cir Unit 54
- 1019 Crown Oak St Unit 51
- 1017 Crown Oak St Unit 50
- 1007 Crown Oak St Unit 45
- 1003 Crown Oak St Unit 43
- 1005 Crown Oak St Unit 44
- 1011 Crown Oak St Unit 47
- 9950 Farmbrook Ln
- 5170 Cameron Forest Pkwy
- 149 Wards Crossing Way Unit 10
- 149 Wards Crossing Way
- 720 Buttercup Trace
- 153 Wards Crossing Way Unit 8
- 153 Wards Crossing Way
- The Ellington Plan at Ward's Crossing
- 325 Fernly Park Dr
- 10295 Twingate Dr
- 10285 Twingate Dr
- 330 Fernly Park Dr
- 320 Fernly Park Dr
- 310 Fernly Park Dr
- 340 Fernly Park Dr
- 335 Fernly Park Dr
- 300 Fernly Park Dr
- 350 Fernly Park Dr
- 10275 Twingate Dr
- 345 Fernly Park Dr Unit 7
- 360 Fernly Park Dr Unit 7
- 10325 Twingate Dr Unit XII
- 10260 Twingate Dr
- 315 Newington Ct
- 10265 Twingate Dr Unit 7
- 10335 Twingate Dr
- 325 Newington Ct Unit XII
- 335 Newington Ct Unit 12