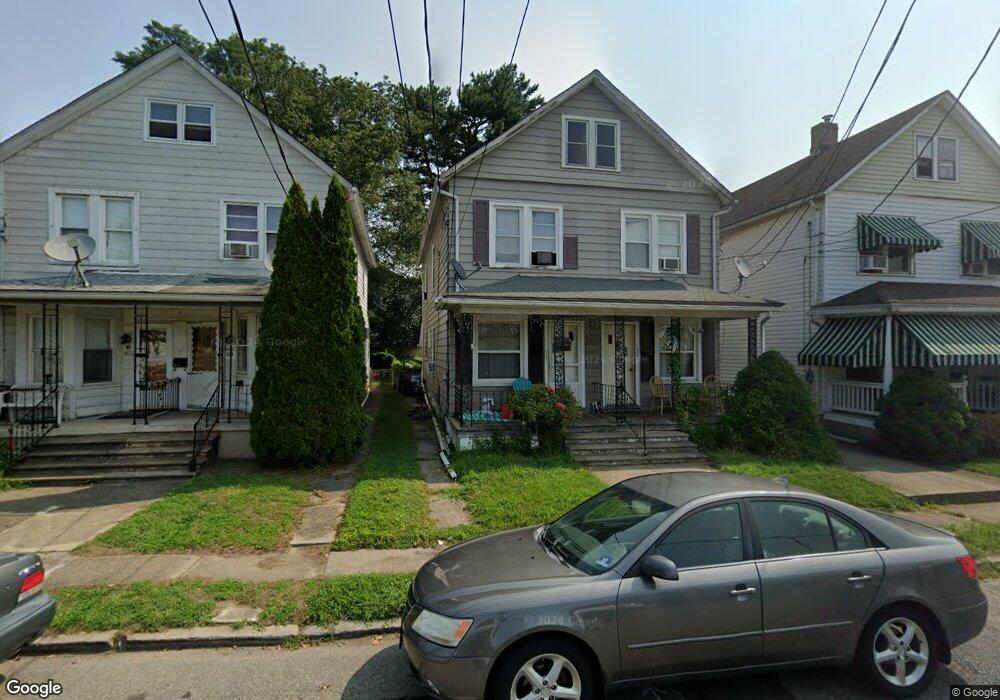
315 Firth St Unit 17 Phillipsburg, NJ 08865
Estimated Value: $265,874 - $332,000
--
Bed
--
Bath
2,112
Sq Ft
$145/Sq Ft
Est. Value
About This Home
This home is located at 315 Firth St Unit 17, Phillipsburg, NJ 08865 and is currently estimated at $307,219, approximately $145 per square foot. 315 Firth St Unit 17 is a home located in Warren County with nearby schools including Phillipsburg High School, Easton Arts Academy Elementary Cs, and Sts. Philip & James School.
Ownership History
Date
Name
Owned For
Owner Type
Purchase Details
Closed on
Oct 30, 1997
Sold by
Lebedin Steven B and Lebedin Elaine
Bought by
Stefancin John J
Current Estimated Value
Home Financials for this Owner
Home Financials are based on the most recent Mortgage that was taken out on this home.
Original Mortgage
$78,221
Outstanding Balance
$12,735
Interest Rate
7.19%
Mortgage Type
FHA
Estimated Equity
$294,484
Create a Home Valuation Report for This Property
The Home Valuation Report is an in-depth analysis detailing your home's value as well as a comparison with similar homes in the area
Home Values in the Area
Average Home Value in this Area
Purchase History
| Date | Buyer | Sale Price | Title Company |
|---|---|---|---|
| Stefancin John J | $80,000 | -- |
Source: Public Records
Mortgage History
| Date | Status | Borrower | Loan Amount |
|---|---|---|---|
| Open | Stefancin John J | $78,221 |
Source: Public Records
Tax History Compared to Growth
Tax History
| Year | Tax Paid | Tax Assessment Tax Assessment Total Assessment is a certain percentage of the fair market value that is determined by local assessors to be the total taxable value of land and additions on the property. | Land | Improvement |
|---|---|---|---|---|
| 2025 | $6,013 | $132,300 | $26,100 | $106,200 |
| 2024 | $5,551 | $132,300 | $26,100 | $106,200 |
| 2023 | $5,488 | $132,300 | $26,100 | $106,200 |
| 2022 | $5,488 | $132,300 | $26,100 | $106,200 |
| 2021 | $5,312 | $132,300 | $26,100 | $106,200 |
| 2020 | $5,348 | $132,300 | $26,100 | $106,200 |
| 2019 | $5,267 | $132,300 | $26,100 | $106,200 |
| 2018 | $5,267 | $132,300 | $26,100 | $106,200 |
| 2017 | $5,243 | $132,300 | $26,100 | $106,200 |
| 2016 | $5,162 | $132,300 | $26,100 | $106,200 |
| 2015 | $5,123 | $132,300 | $26,100 | $106,200 |
| 2014 | $4,956 | $132,300 | $26,100 | $106,200 |
Source: Public Records
Map
Nearby Homes