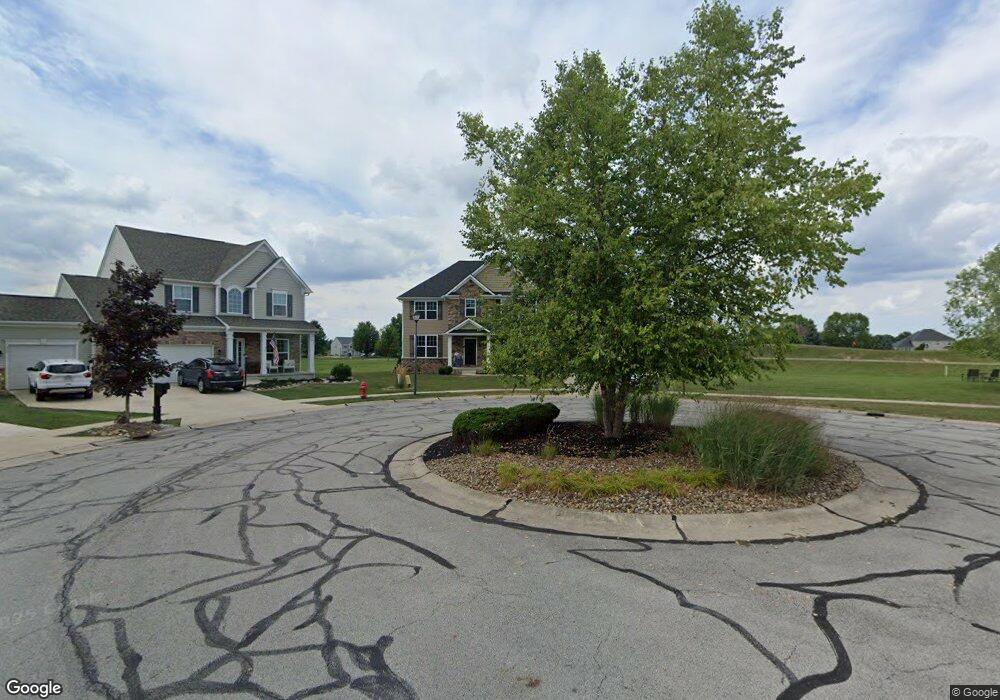
315 Garfield Dr Lagrange, OH 44050
Estimated Value: $424,000 - $523,000
4
Beds
3
Baths
2,685
Sq Ft
$170/Sq Ft
Est. Value
About This Home
This home is located at 315 Garfield Dr, Lagrange, OH 44050 and is currently estimated at $456,631, approximately $170 per square foot. 315 Garfield Dr is a home with nearby schools including Keystone Elementary School, Keystone Middle School, and Keystone High School.
Ownership History
Date
Name
Owned For
Owner Type
Purchase Details
Closed on
Jul 24, 2017
Sold by
Greco Building Group Inc
Bought by
Wreh Elijah N and Wreh Gradieh S
Current Estimated Value
Home Financials for this Owner
Home Financials are based on the most recent Mortgage that was taken out on this home.
Original Mortgage
$248,540
Outstanding Balance
$204,479
Interest Rate
3.89%
Mortgage Type
New Conventional
Estimated Equity
$252,152
Purchase Details
Closed on
Dec 8, 2014
Sold by
Greyhawk Land Holdings Llc
Bought by
The Greco Building Group
Purchase Details
Closed on
Jan 13, 2014
Sold by
All American Homes Of Indiana Llc
Bought by
Greyhawk Land Holdings Llc
Purchase Details
Closed on
Dec 20, 2007
Sold by
Durham Ridge Investments Llc
Bought by
All American Homes Of Indiana Llc
Create a Home Valuation Report for This Property
The Home Valuation Report is an in-depth analysis detailing your home's value as well as a comparison with similar homes in the area
Home Values in the Area
Average Home Value in this Area
Purchase History
| Date | Buyer | Sale Price | Title Company |
|---|---|---|---|
| Wreh Elijah N | $25,000 | Fidelity National Title | |
| The Greco Building Group | $42,000 | Revere Title Agency Inc | |
| Greyhawk Land Holdings Llc | $33,300 | Revere Title Agency Inc | |
| All American Homes Of Indiana Llc | $447,200 | Title Access Llc |
Source: Public Records
Mortgage History
| Date | Status | Borrower | Loan Amount |
|---|---|---|---|
| Open | Wreh Elijah N | $248,540 |
Source: Public Records
Tax History
| Year | Tax Paid | Tax Assessment Tax Assessment Total Assessment is a certain percentage of the fair market value that is determined by local assessors to be the total taxable value of land and additions on the property. | Land | Improvement |
|---|---|---|---|---|
| 2024 | $5,898 | $136,518 | $26,250 | $110,268 |
| 2023 | $6,548 | $126,539 | $17,217 | $109,323 |
| 2022 | $6,360 | $123,711 | $17,217 | $106,495 |
| 2021 | $6,362 | $123,711 | $17,217 | $106,495 |
| 2020 | $6,531 | $113,180 | $15,750 | $97,430 |
| 2019 | $6,495 | $113,180 | $15,750 | $97,430 |
| 2018 | $5,744 | $103,440 | $15,750 | $87,690 |
| 2017 | $584 | $9,840 | $9,840 | $0 |
| 2016 | $580 | $9,840 | $9,840 | $0 |
| 2015 | $579 | $9,840 | $9,840 | $0 |
| 2014 | $567 | $10,360 | $10,360 | $0 |
| 2013 | $525 | $10,360 | $10,360 | $0 |
Source: Public Records
Map
Nearby Homes
- 548 William St
- 608 Rundle St
- 516 Appomattox Ct
- 700 Hayes St
- 808 Buckingham Dr
- 336 Granger Dr
- 800 Buckingham Dr
- 801 Willich Ct
- 613 U s Grant St
- 17327 Wheeler Rd
- 305 W Main St
- 110 Railroad St
- 40260 Whitney Rd
- 18022 State Route 301
- 0 Whitehead Rd
- 14768 Whitehead Rd
- 40175 Banks Rd
- 39112 Parsons Rd
- 17058 Chamberlain Rd
- 40163 Banks Rd
- 317 Garfield Dr
- 313 Garfield Dr
- 312 Garfield Dr
- 314 Garfield Dr Unit SL112
- 314 Garfield Dr
- 308 Garfield Dr
- 310 Garfield Dr
- 311 Garfield Dr
- 540 William St
- 309 Garfield Dr Unit SL117
- 309 Garfield Dr
- 306 Garfield Dr
- 307 Garfield Dr
- 532 William St
- 210 General Lee St
- 304 Garfield Dr
- 215 Hendrix Blvd
- 221 Hendrix Blvd
- 209 Hendrix Blvd
- S/L 32 William St
Your Personal Tour Guide
Ask me questions while you tour the home.