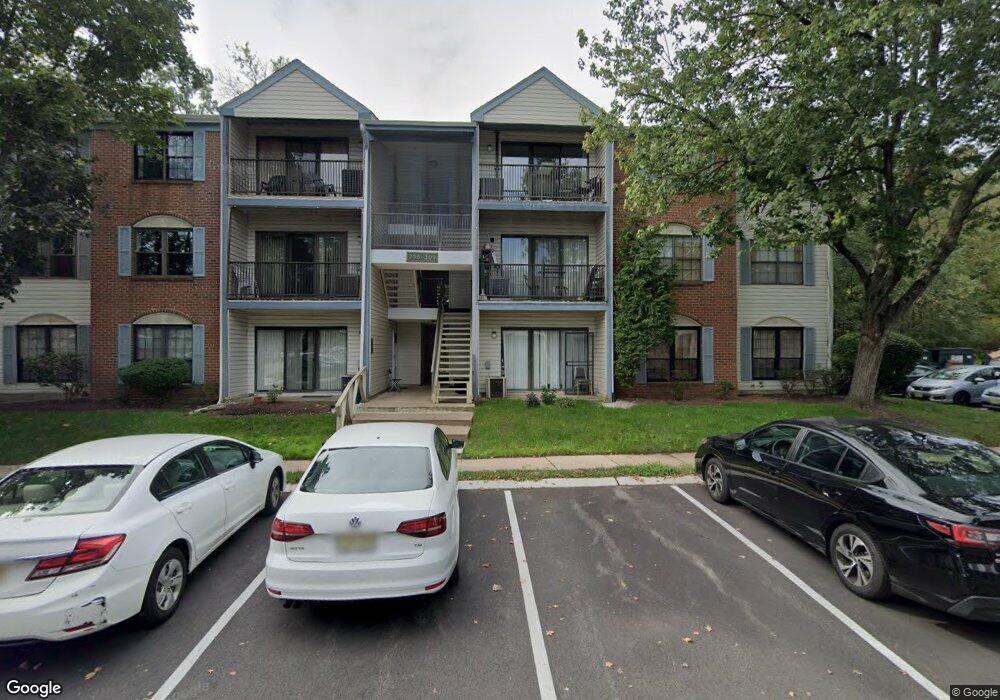
315 Hampshire Ct Piscataway, NJ 08854
Estimated Value: $378,441 - $405,000
--
Bed
--
Bath
1,138
Sq Ft
$343/Sq Ft
Est. Value
About This Home
This home is located at 315 Hampshire Ct, Piscataway, NJ 08854 and is currently estimated at $390,860, approximately $343 per square foot. 315 Hampshire Ct is a home located in Middlesex County with nearby schools including Martin Luther King Intermediate School, Randolphville Elementary School, and Conackamack Middle School.
Ownership History
Date
Name
Owned For
Owner Type
Purchase Details
Closed on
Sep 9, 2002
Sold by
Errington Frank
Bought by
Adjmi Charles
Current Estimated Value
Home Financials for this Owner
Home Financials are based on the most recent Mortgage that was taken out on this home.
Original Mortgage
$124,720
Outstanding Balance
$53,011
Interest Rate
6.48%
Estimated Equity
$337,849
Purchase Details
Closed on
Apr 2, 2002
Sold by
Price Justin
Bought by
Singleton Jeanetta and Golden Derek
Home Financials for this Owner
Home Financials are based on the most recent Mortgage that was taken out on this home.
Original Mortgage
$135,703
Interest Rate
6.88%
Mortgage Type
FHA
Purchase Details
Closed on
Nov 15, 2000
Sold by
Rosenzweig Philip
Bought by
Price Justin
Home Financials for this Owner
Home Financials are based on the most recent Mortgage that was taken out on this home.
Original Mortgage
$97,250
Interest Rate
7.64%
Mortgage Type
FHA
Create a Home Valuation Report for This Property
The Home Valuation Report is an in-depth analysis detailing your home's value as well as a comparison with similar homes in the area
Home Values in the Area
Average Home Value in this Area
Purchase History
| Date | Buyer | Sale Price | Title Company |
|---|---|---|---|
| Adjmi Charles | $155,900 | -- | |
| Singleton Jeanetta | $139,900 | -- | |
| Price Justin | $99,500 | -- |
Source: Public Records
Mortgage History
| Date | Status | Borrower | Loan Amount |
|---|---|---|---|
| Open | Adjmi Charles | $124,720 | |
| Previous Owner | Singleton Jeanetta | $135,703 | |
| Previous Owner | Price Justin | $97,250 |
Source: Public Records
Tax History Compared to Growth
Tax History
| Year | Tax Paid | Tax Assessment Tax Assessment Total Assessment is a certain percentage of the fair market value that is determined by local assessors to be the total taxable value of land and additions on the property. | Land | Improvement |
|---|---|---|---|---|
| 2025 | $6,035 | $351,300 | $195,000 | $156,300 |
| 2024 | $5,850 | $308,400 | $155,000 | $153,400 |
| 2023 | $5,850 | $279,900 | $130,000 | $149,900 |
| 2022 | $5,691 | $252,700 | $110,000 | $142,700 |
| 2021 | $5,567 | $237,700 | $110,000 | $127,700 |
| 2020 | $5,363 | $229,600 | $110,000 | $119,600 |
| 2019 | $5,619 | $236,500 | $110,000 | $126,500 |
| 2018 | $5,434 | $229,100 | $110,000 | $119,100 |
| 2017 | $4,857 | $177,200 | $70,000 | $107,200 |
| 2016 | $4,767 | $177,200 | $70,000 | $107,200 |
| 2015 | $4,699 | $177,200 | $70,000 | $107,200 |
| 2014 | $4,593 | $177,200 | $70,000 | $107,200 |
Source: Public Records
Map
Nearby Homes
- 255 Hampshire Ct Unit D2
- 336 Lancaster Ct Unit 2336
- 352 Lancaster Ct
- 418 Lancaster Ct Unit 62
- 32 Canterbury Ct
- 127 Berkshire Ct
- 5 Angela Ct
- 73 Morris Ave
- 21 Thornton Ln
- 4 Dewey Ct
- 2 Sturbridge Dr
- 18 High Point Way
- 80 Mitchell Ave
- 385 Metlars Ln
- 206 Overbrook Rd
- 76 Woodland Rd
- 61 Lakeside Dr S
- 148 Woodland Rd
- 131 Woodland Rd
- 126 Lakeside Dr N
- 299 Hampshire Ct
- 314 Hampshire Ct
- 306 Hampshire Ct
- 316 Hampshire Ct Unit C2
- 298 Hampshire Ct
- 308 Hampshire Ct
- 317 Hampshire Ct Unit H2
- 300 Hampshire Ct
- 309 Hampshire Ct
- 301 Hampshire Ct
- 319 Hampshire Ct
- 303 Hampshire Ct
- 310 Hampshire Ct
- 318 Hampshire Ct Unit A3
- 302 Hampshire Ct
- 302 Hampshire Ct Unit 302
- 302 Hampshire Ct Unit 2302
- 281 Hampshire Ct
- 320 Hampshire Ct
- 321 Hampshire Ct