Estimated Value: $326,915
3
Beds
2
Baths
4,800
Sq Ft
$68/Sq Ft
Est. Value
About This Home
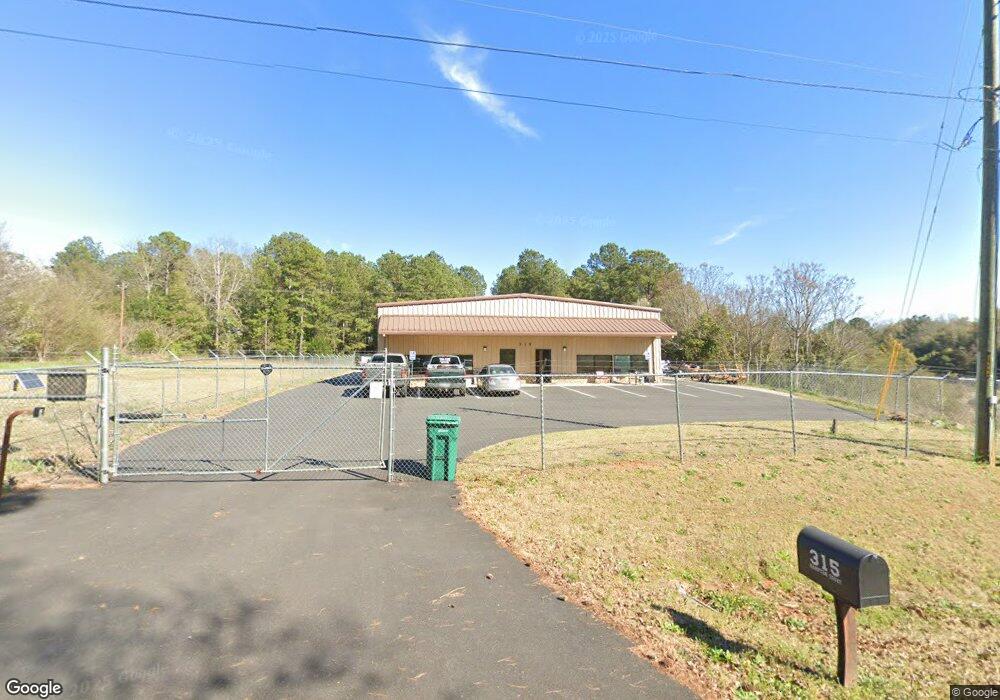
This home is located at 315 Hampton Ct, Perry, GA 31069 and is currently estimated at $326,915, approximately $68 per square foot. 315 Hampton Ct is a home located in Houston County with nearby schools including Morningside Elementary School, Perry Middle School, and Perry High School.
Ownership History
Date
Name
Owned For
Owner Type
Purchase Details
Closed on
Jun 22, 2018
Sold by
Extra Point Publishers Inc
Bought by
Daniel Malcolm L
Current Estimated Value
Purchase Details
Closed on
Jan 21, 2016
Sold by
Luke Yoder Construction In
Bought by
Yoder Luke
Purchase Details
Closed on
Jul 16, 2013
Sold by
Eubanks Reuben D
Bought by
Yoder Luke
Purchase Details
Closed on
Jun 21, 2013
Sold by
Eubanks Reuben
Bought by
Eubanks Deborah and Eubanks Reuben
Purchase Details
Closed on
Dec 16, 2010
Sold by
Britt Michael G and Britt Melissa Ann
Bought by
Help Solvers Inc and Extra Point Publishers
Home Financials for this Owner
Home Financials are based on the most recent Mortgage that was taken out on this home.
Original Mortgage
$158,000
Interest Rate
4.32%
Mortgage Type
Seller Take Back
Purchase Details
Closed on
May 4, 2010
Sold by
Michael Britt Electric Inc
Bought by
Britt Michael G and Britt Melissa Ann
Create a Home Valuation Report for This Property
The Home Valuation Report is an in-depth analysis detailing your home's value as well as a comparison with similar homes in the area
Home Values in the Area
Average Home Value in this Area
Purchase History
| Date | Buyer | Sale Price | Title Company |
|---|---|---|---|
| Daniel Malcolm L | $185,000 | None Available | |
| Yoder Luke | -- | -- | |
| Yoder Luke | $37,000 | -- | |
| Eubanks Deborah | -- | -- | |
| Help Solvers Inc | $168,000 | None Available | |
| Britt Michael G | -- | None Available |
Source: Public Records
Mortgage History
| Date | Status | Borrower | Loan Amount |
|---|---|---|---|
| Previous Owner | Help Solvers Inc | $158,000 |
Source: Public Records
Tax History Compared to Growth
Tax History
| Year | Tax Paid | Tax Assessment Tax Assessment Total Assessment is a certain percentage of the fair market value that is determined by local assessors to be the total taxable value of land and additions on the property. | Land | Improvement |
|---|---|---|---|---|
| 2024 | $3,310 | $90,080 | $13,280 | $76,800 |
| 2023 | $3,325 | $89,880 | $13,280 | $76,600 |
| 2022 | $2,067 | $89,880 | $13,280 | $76,600 |
| 2021 | $2,095 | $90,640 | $13,280 | $77,360 |
| 2020 | $2,214 | $95,280 | $20,680 | $74,600 |
| 2019 | $1,719 | $85,720 | $9,480 | $76,240 |
| 2018 | $1,839 | $79,160 | $9,480 | $69,680 |
| 2017 | $1,841 | $79,160 | $9,480 | $69,680 |
| 2016 | $1,844 | $79,160 | $9,480 | $69,680 |
| 2015 | $1,478 | $63,320 | $9,480 | $53,840 |
| 2014 | -- | $63,320 | $9,480 | $53,840 |
| 2013 | -- | $63,280 | $9,480 | $53,800 |
Source: Public Records
Map
Nearby Homes
- 1335 Ball St
- 1343 Wf Ragin Dr
- 1312 Sam Nunn Blvd
- 202 Obsidian Dr
- 132 Bramblewood Ln
- 118 Bramblewood Ln
- 713 Walcott St
- 1110 Creekwood Dr
- 0 Perimeter Rd Unit 236479
- 0 Perimeter Rd Unit 236478
- 0 Perimeter Rd Unit 20145467
- The Pearson Plan at Avalon
- The Crawford Plan at Avalon
- The Piedmont Plan at Avalon
- The Lawson Plan at Avalon
- The Coleman Plan at Avalon
- The McGinnis Plan at Avalon
- The Harrington Plan at Avalon
- The Bradley Plan at Avalon
- 128 Kenmore Cir Unit 15
- 106 Smith Dr
- 1325 Whipple St
- 1323 Whipple St
- 1319 Whipple St
- 1317 Whipple St
- 1315 Whipple St
- 1313 Whipple St
- 1314 Whipple St
- 711 Rosenwald St
- 1301A Whipple St Unit B
- 1320 Whipple St
- 1318 Whipple St
- 104 Hampton Ct
- 111 Hampton Way
- 1307 Whipple St
- 1305 Whipple St
- 706 Rosenwald St
- 1310 Whipple St
- 1312 Whipple St
- 420 Valley Dr