315 Hayward Ln Alpharetta, GA 30022
Estimated Value: $1,024,085 - $1,212,000
5
Beds
5
Baths
3,886
Sq Ft
$294/Sq Ft
Est. Value
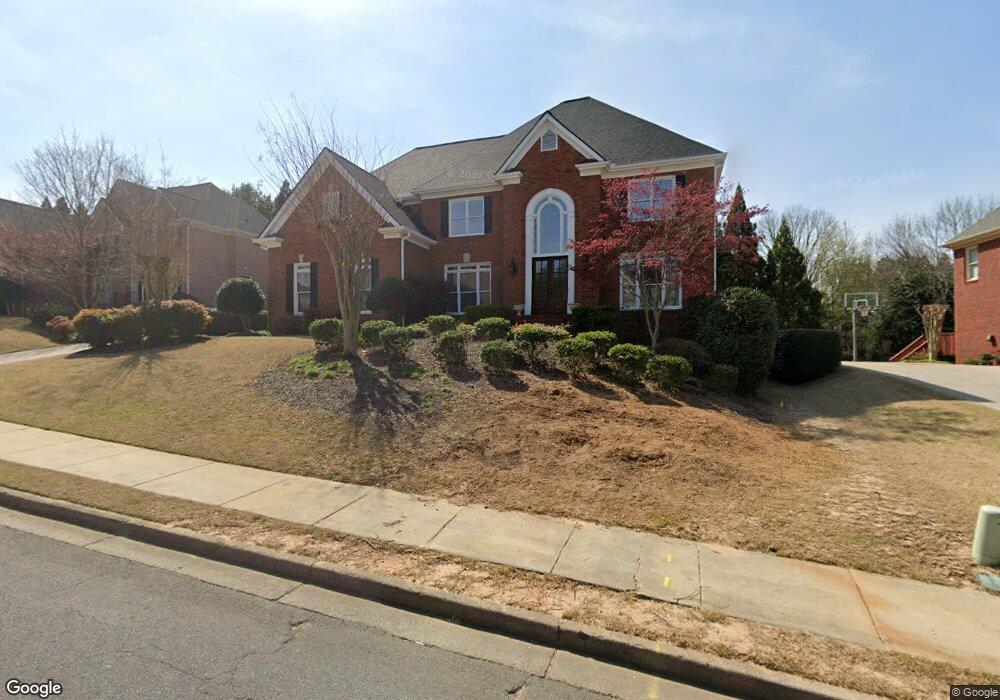
About This Home
This home is located at 315 Hayward Ln, Alpharetta, GA 30022 and is currently estimated at $1,142,021, approximately $293 per square foot. 315 Hayward Ln is a home located in Fulton County with nearby schools including New Prospect Elementary School, Webb Bridge Middle School, and Alpharetta High School.
Ownership History
Date
Name
Owned For
Owner Type
Purchase Details
Closed on
Oct 4, 2010
Sold by
Coggins Gary W and Coggins Kimberly C
Bought by
Cozad Matthew and Cozad Megan
Current Estimated Value
Home Financials for this Owner
Home Financials are based on the most recent Mortgage that was taken out on this home.
Original Mortgage
$417,000
Outstanding Balance
$276,154
Interest Rate
4.42%
Mortgage Type
New Conventional
Estimated Equity
$865,867
Purchase Details
Closed on
Mar 24, 1999
Sold by
Walters Mark A and Walters Michelle B
Bought by
Coggins Gary W and Coggins Kimberly C
Home Financials for this Owner
Home Financials are based on the most recent Mortgage that was taken out on this home.
Original Mortgage
$336,000
Interest Rate
6.74%
Mortgage Type
New Conventional
Purchase Details
Closed on
Apr 16, 1998
Sold by
Ray Vick Homes Inc
Bought by
Walters Mark A and Walters Michelle B
Home Financials for this Owner
Home Financials are based on the most recent Mortgage that was taken out on this home.
Original Mortgage
$240,000
Interest Rate
7.03%
Mortgage Type
New Conventional
Create a Home Valuation Report for This Property
The Home Valuation Report is an in-depth analysis detailing your home's value as well as a comparison with similar homes in the area
Home Values in the Area
Average Home Value in this Area
Purchase History
| Date | Buyer | Sale Price | Title Company |
|---|---|---|---|
| Cozad Matthew | $603,000 | -- | |
| Coggins Gary W | $380,000 | -- | |
| Walters Mark A | $361,800 | -- |
Source: Public Records
Mortgage History
| Date | Status | Borrower | Loan Amount |
|---|---|---|---|
| Open | Cozad Matthew | $417,000 | |
| Previous Owner | Coggins Gary W | $336,000 | |
| Previous Owner | Walters Mark A | $240,000 |
Source: Public Records
Tax History Compared to Growth
Tax History
| Year | Tax Paid | Tax Assessment Tax Assessment Total Assessment is a certain percentage of the fair market value that is determined by local assessors to be the total taxable value of land and additions on the property. | Land | Improvement |
|---|---|---|---|---|
| 2025 | $1,142 | $360,800 | $128,400 | $232,400 |
| 2023 | $8,362 | $296,240 | $64,560 | $231,680 |
| 2022 | $5,446 | $241,160 | $47,440 | $193,720 |
| 2021 | $6,316 | $215,840 | $47,320 | $168,520 |
| 2020 | $6,430 | $219,760 | $36,040 | $183,720 |
| 2019 | $967 | $215,880 | $35,400 | $180,480 |
| 2018 | $5,610 | $210,840 | $34,600 | $176,240 |
| 2017 | $5,222 | $190,920 | $36,440 | $154,480 |
| 2016 | $5,221 | $190,920 | $36,440 | $154,480 |
| 2015 | $6,140 | $190,920 | $36,440 | $154,480 |
| 2014 | $5,053 | $177,600 | $33,880 | $143,720 |
Source: Public Records
Map
Nearby Homes
- 465 Kirkstall Trail
- 10845 Carrissa Trail
- 345 Kincardine Way Unit IIIA
- 125 Sandridge Ct
- 10880 Windham Way
- 610 Varina Way
- 105 Kimball Bridge Cove
- 825 Highland Bend Cove
- 3962 Erin Dr
- 10530 Tuxford Dr
- 10900 Wittenridge Dr Unit I3
- 10900 Wittenridge Dr Unit H8
- 10900 Wittenridge Dr Unit L6
- 285 Rolling Mist Ct
- 355 Fairleaf Ct
- 3396 Carverton Ln
- 870 Longstone Landing
- 0 Hayward Ln Unit 7320217
- 0 Hayward Ln Unit 7278954
- 0 Hayward Ln
- 325 Hayward Ln
- 305 Hayward Ln
- 300 Hayward Ln
- 715 Mallory Manor Ct
- 930 Turlough Trail
- 335 Hayward Ln
- 310 Hayward Ln
- 920 Turlough Trail
- 710 Mallory Manor Ct
- 0 Mallory Manor Ct Unit 7128122
- 0 Mallory Manor Ct Unit 3235195
- 0 Mallory Manor Ct Unit 8151542
- 0 Mallory Manor Ct Unit 7641234
- 0 Mallory Manor Ct Unit 7639177
- 0 Mallory Manor Ct
- 720 Mallory Manor Ct Unit 1
- 755 Mallory Manor Ct