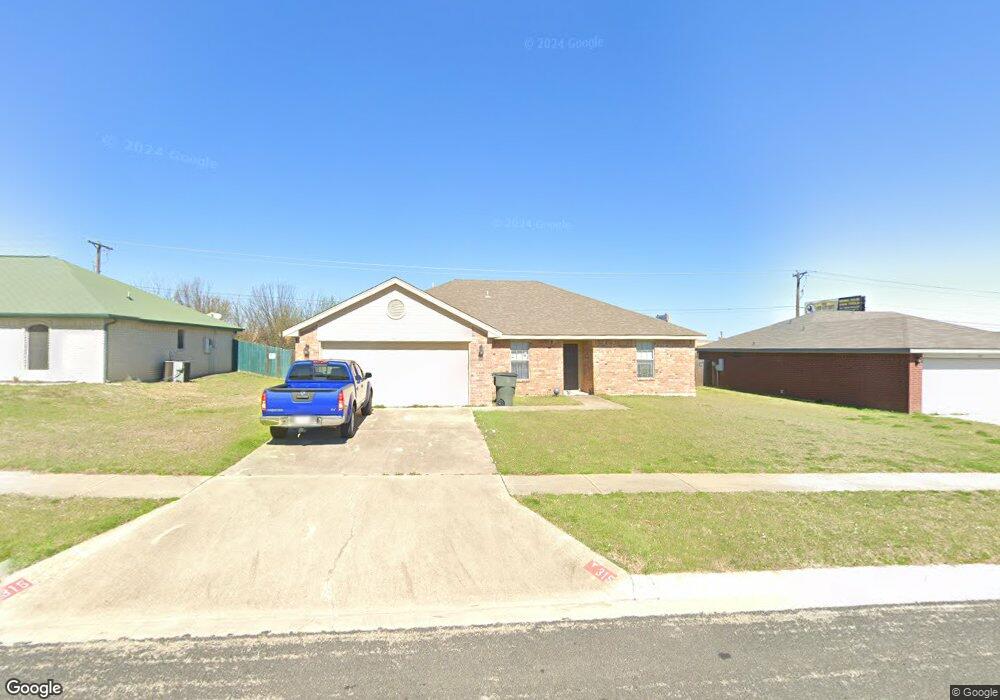
315 James Loop Killeen, TX 76542
Estimated Value: $208,359 - $219,000
4
Beds
2
Baths
1,542
Sq Ft
$139/Sq Ft
Est. Value
About This Home
This home is located at 315 James Loop, Killeen, TX 76542 and is currently estimated at $214,340, approximately $139 per square foot. 315 James Loop is a home located in Bell County with nearby schools including Reeces Creek Elementary School, Charles E. Patterson Middle School, and C. E. Ellison High School.
Ownership History
Date
Name
Owned For
Owner Type
Purchase Details
Closed on
Nov 14, 2011
Sold by
Secretary Of Veterans Affairs
Bought by
Ottmers Carlton W and Ottmers Deborah P
Current Estimated Value
Home Financials for this Owner
Home Financials are based on the most recent Mortgage that was taken out on this home.
Original Mortgage
$84,502
Outstanding Balance
$57,983
Interest Rate
4.15%
Mortgage Type
VA
Estimated Equity
$156,357
Purchase Details
Closed on
Oct 11, 2010
Sold by
Wells Fargo Bank N A
Bought by
Secretary Of Veterans Affairs
Purchase Details
Closed on
Oct 5, 2010
Sold by
Malkemus Matthew E and Malkemus Jasmine Lm
Bought by
Wells Fargo Bank N A
Purchase Details
Closed on
Mar 29, 2010
Sold by
Vella Bridget B and Vella John H
Bought by
Malkemus Jasmine Lm
Home Financials for this Owner
Home Financials are based on the most recent Mortgage that was taken out on this home.
Original Mortgage
$102,150
Interest Rate
5%
Mortgage Type
VA
Create a Home Valuation Report for This Property
The Home Valuation Report is an in-depth analysis detailing your home's value as well as a comparison with similar homes in the area
Home Values in the Area
Average Home Value in this Area
Purchase History
| Date | Buyer | Sale Price | Title Company |
|---|---|---|---|
| Ottmers Carlton W | -- | None Available | |
| Secretary Of Veterans Affairs | -- | None Available | |
| Wells Fargo Bank N A | $83,724 | None Available | |
| Malkemus Jasmine Lm | -- | Land Exchange Abstract & Tit |
Source: Public Records
Mortgage History
| Date | Status | Borrower | Loan Amount |
|---|---|---|---|
| Open | Ottmers Carlton W | $84,502 | |
| Previous Owner | Malkemus Jasmine Lm | $102,150 |
Source: Public Records
Tax History
| Year | Tax Paid | Tax Assessment Tax Assessment Total Assessment is a certain percentage of the fair market value that is determined by local assessors to be the total taxable value of land and additions on the property. | Land | Improvement |
|---|---|---|---|---|
| 2025 | $4,402 | $206,106 | $33,000 | $173,106 |
| 2024 | $4,106 | $206,106 | $33,000 | $173,106 |
| 2023 | $3,848 | $203,272 | $25,000 | $178,272 |
| 2022 | $3,772 | $179,213 | $25,000 | $154,213 |
| 2021 | $3,366 | $140,091 | $25,000 | $115,091 |
| 2020 | $3,304 | $131,005 | $25,000 | $106,005 |
| 2019 | $3,102 | $117,779 | $10,800 | $106,979 |
| 2018 | $2,658 | $108,291 | $10,800 | $97,491 |
| 2017 | $2,742 | $111,125 | $10,800 | $100,325 |
| 2016 | $2,496 | $101,154 | $10,800 | $90,354 |
| 2015 | $2,293 | $95,276 | $10,800 | $84,476 |
| 2014 | $2,293 | $92,853 | $0 | $0 |
Source: Public Records
Map
Nearby Homes
- 313 James Loop
- 317 James Loop
- 311 James Loop
- 4802 Norton Dr
- 309 James Loop
- 403 James Loop
- 4801 Norton Dr
- 4801 Mikey Dr
- 00 W Stan Schlueter Loop
- 4804 Norton Dr
- 4803 Norton Dr
- 307 James Loop
- 405 James Loop
- 4803 Mikey Dr
- 311 E Stan Schlueter Loop
- 4802 Topsey Dr
- 4806 Norton Dr
- 403 E Stan Schlueter Loop
- 4805 Norton Dr
- 403 E Stan Schlueter Loop
Your Personal Tour Guide
Ask me questions while you tour the home.