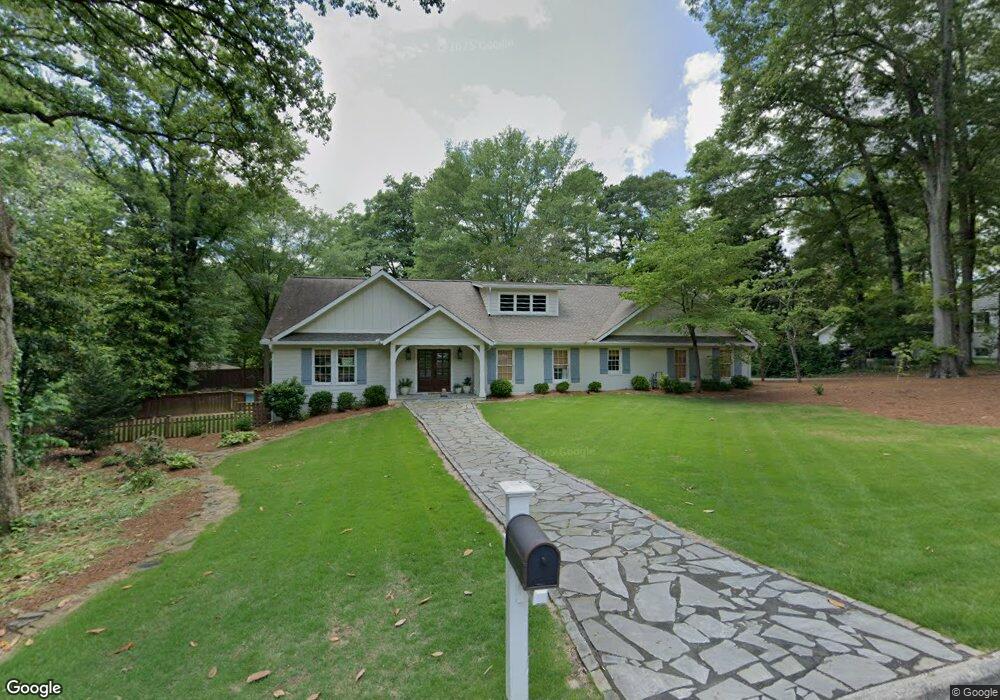
315 Kramer St Carrollton, GA 30117
Estimated Value: $361,000 - $717,121
3
Beds
3
Baths
2,126
Sq Ft
$262/Sq Ft
Est. Value
About This Home
This home is located at 315 Kramer St, Carrollton, GA 30117 and is currently estimated at $557,530, approximately $262 per square foot. 315 Kramer St is a home located in Carroll County with nearby schools including Carrollton Elementary School, Carrollton Upper Elementary School, and Carrollton Middle School.
Ownership History
Date
Name
Owned For
Owner Type
Purchase Details
Closed on
Apr 14, 2023
Sold by
Bingham Hannah
Bought by
Mccall Jill Hampton and Mccall George Allen
Current Estimated Value
Purchase Details
Closed on
Jul 13, 2018
Sold by
Bingham Austen G
Bought by
Bingham Hannah
Home Financials for this Owner
Home Financials are based on the most recent Mortgage that was taken out on this home.
Original Mortgage
$250,000
Interest Rate
4.6%
Mortgage Type
New Conventional
Purchase Details
Closed on
Aug 15, 2016
Sold by
Robert Benjamin /Tr
Bought by
Bingham Austen G and Bingham Hannah
Purchase Details
Closed on
Oct 21, 2011
Sold by
Robinson John T
Bought by
Bell Robert Ben
Purchase Details
Closed on
May 7, 2001
Sold by
Robinson John T
Bought by
Robinson John T
Purchase Details
Closed on
Jun 8, 1954
Bought by
Robinson John T
Create a Home Valuation Report for This Property
The Home Valuation Report is an in-depth analysis detailing your home's value as well as a comparison with similar homes in the area
Home Values in the Area
Average Home Value in this Area
Purchase History
| Date | Buyer | Sale Price | Title Company |
|---|---|---|---|
| Mccall Jill Hampton | $695,000 | -- | |
| Bingham Hannah | -- | -- | |
| Bingham Austen G | $105,000 | -- | |
| Bell Robert Ben | -- | -- | |
| Robinson John T | -- | -- | |
| Robinson John T | -- | -- |
Source: Public Records
Mortgage History
| Date | Status | Borrower | Loan Amount |
|---|---|---|---|
| Previous Owner | Bingham Hannah | $250,000 |
Source: Public Records
Tax History Compared to Growth
Tax History
| Year | Tax Paid | Tax Assessment Tax Assessment Total Assessment is a certain percentage of the fair market value that is determined by local assessors to be the total taxable value of land and additions on the property. | Land | Improvement |
|---|---|---|---|---|
| 2024 | $6,770 | $247,775 | $52,896 | $194,879 |
| 2023 | $6,770 | $229,956 | $52,896 | $177,060 |
| 2022 | $5,179 | $181,436 | $35,264 | $146,172 |
| 2021 | $4,415 | $151,242 | $26,100 | $125,142 |
| 2020 | $3,990 | $136,554 | $26,100 | $110,454 |
| 2019 | $3,683 | $124,873 | $26,100 | $98,773 |
| 2018 | $3,263 | $109,036 | $26,100 | $82,936 |
| 2017 | $1,264 | $43,021 | $26,100 | $16,921 |
| 2016 | $1,783 | $58,942 | $26,100 | $32,842 |
| 2015 | $596 | $57,020 | $26,600 | $30,420 |
| 2014 | $601 | $57,020 | $26,600 | $30,420 |
Source: Public Records
Map
Nearby Homes
- 516 Longview St
- 0 Hwy 27 None N
- 27 South St
- 160 Watson St
- 219 Broad St
- 301 Bradley St
- 301 C4 Bradley St
- 423 Clifton Terrace
- 109 S Park St
- 105 Mara St
- 105 Haygood Place
- 141 Bowen St
- 117 Orion Terrace
- 142 Griffin Dr
- 205 Johnson Ave Unit 231
- TRACT1-7 Us Highway 27
- 308 Old Mill Dr
- 0 Ward St Unit 10390499
- 406 Harmon Ave
- 108 Springwood Dr
- 309 Kramer St
- 0 Kramer St Unit 7156916
- 0 Kramer St Unit 8022650
- 0 Kramer St
- 220 Oak Ave
- 218 Oak Ave
- 210 Oak Ave
- 327 Kramer St
- 327 Kramer St
- 327 Kramer St
- 327 Kramer St
- 327 Kramer St
- 0 Oak Ave Unit 3259592
- 0 Oak Ave Unit 8398157
- 0 Oak Ave Unit 8399493
- 0 Oak Ave
- 312 Kramer St
- 217 Oak Ave
- 305 Kramer St
- 202 Oak Ave