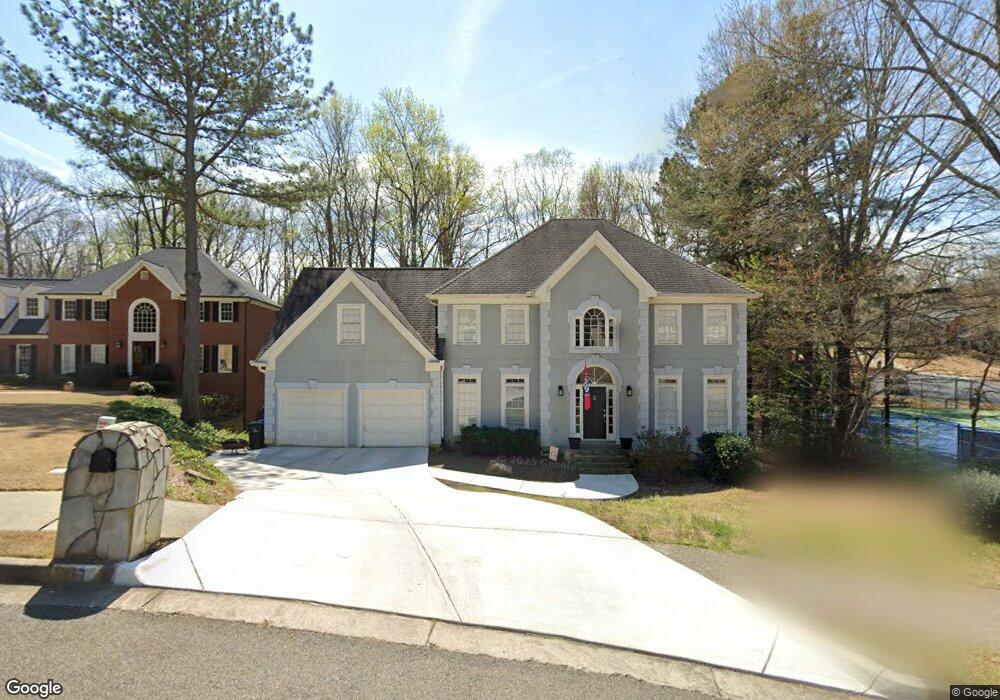
315 Leycroft Ct Alpharetta, GA 30022
Estimated Value: $778,000 - $997,000
5
Beds
4
Baths
3,370
Sq Ft
$263/Sq Ft
Est. Value
About This Home
This home is located at 315 Leycroft Ct, Alpharetta, GA 30022 and is currently estimated at $884,844, approximately $262 per square foot. 315 Leycroft Ct is a home located in Fulton County with nearby schools including Dolvin Elementary School, Autrey Mill Middle School, and Johns Creek High School.
Ownership History
Date
Name
Owned For
Owner Type
Purchase Details
Closed on
Jun 23, 2006
Sold by
Connor George B and Connor Mary L
Bought by
Murray Terrence and Murray Melissa D
Current Estimated Value
Home Financials for this Owner
Home Financials are based on the most recent Mortgage that was taken out on this home.
Original Mortgage
$205,000
Outstanding Balance
$119,983
Interest Rate
6.49%
Mortgage Type
New Conventional
Estimated Equity
$764,861
Purchase Details
Closed on
May 28, 2004
Sold by
Lewis Phillip
Bought by
Connor George B and Connor Mary
Home Financials for this Owner
Home Financials are based on the most recent Mortgage that was taken out on this home.
Original Mortgage
$296,000
Interest Rate
4.75%
Mortgage Type
New Conventional
Purchase Details
Closed on
Apr 30, 1999
Sold by
Gellerman Douglas J and Gellerman Rhonda B
Bought by
Lewis Phillip
Home Financials for this Owner
Home Financials are based on the most recent Mortgage that was taken out on this home.
Original Mortgage
$246,600
Interest Rate
7%
Mortgage Type
New Conventional
Create a Home Valuation Report for This Property
The Home Valuation Report is an in-depth analysis detailing your home's value as well as a comparison with similar homes in the area
Home Values in the Area
Average Home Value in this Area
Purchase History
| Date | Buyer | Sale Price | Title Company |
|---|---|---|---|
| Murray Terrence | $440,000 | -- | |
| Connor George B | $370,000 | -- | |
| Lewis Phillip | $275,000 | -- |
Source: Public Records
Mortgage History
| Date | Status | Borrower | Loan Amount |
|---|---|---|---|
| Open | Murray Terrence | $205,000 | |
| Previous Owner | Connor George B | $296,000 | |
| Previous Owner | Lewis Phillip | $246,600 |
Source: Public Records
Tax History Compared to Growth
Tax History
| Year | Tax Paid | Tax Assessment Tax Assessment Total Assessment is a certain percentage of the fair market value that is determined by local assessors to be the total taxable value of land and additions on the property. | Land | Improvement |
|---|---|---|---|---|
| 2025 | $973 | $315,440 | $77,920 | $237,520 |
| 2023 | $6,428 | $227,720 | $45,320 | $182,400 |
| 2022 | $4,619 | $202,400 | $48,080 | $154,320 |
| 2021 | $5,426 | $195,320 | $50,360 | $144,960 |
| 2020 | $5,466 | $196,000 | $59,920 | $136,080 |
| 2019 | $817 | $192,520 | $58,840 | $133,680 |
| 2018 | $4,499 | $171,480 | $44,040 | $127,440 |
| 2017 | $4,478 | $165,440 | $42,320 | $123,120 |
| 2016 | $4,478 | $165,440 | $42,320 | $123,120 |
| 2015 | $5,247 | $165,440 | $42,320 | $123,120 |
| 2014 | $4,293 | $152,800 | $46,480 | $106,320 |
Source: Public Records
Map
Nearby Homes
- 710 Country Manor Way
- 10515 Colony Glen Dr Unit 2
- 130 Colony Run
- 10415 Plantation Bridge Dr
- 120 Thome Dr
- 125 Oak Bridge Ct Unit 2
- 10530 Tuxford Dr
- 415 Wood Trace Ct
- 235 Wood Shoals Ct
- 9925 Lauren Hall Ct
- 285 Rolling Mist Ct
- 125 Sandridge Ct
- 10050 Lauren Hall Ct
- 10880 Windham Way
- 610 Varina Way
- 10325 Oxford Mill Cir Unit 1
- 11070 Pinewalk Forest Cir
- 465 Kirkstall Trail
- 825 Highland Bend Cove
- 325 Leycroft Ct
- 10630 Centennial Dr Unit 2A
- 10640 Centennial Dr Unit 2A
- 335 Leycroft Ct
- 3905 Brooks Bridge Crossing
- 3900 Brooks Bridge Crossing
- 310 Leycroft Ct Unit 3
- 320 Leycroft Ct
- 0 Leycroft Ct Unit 8943594
- 300 Leycroft Ct
- 505 Country Glen Ct
- 515 Country Glen Ct
- 515 Country Glen Ct
- 10660 Centennial Dr
- 3910 Brooks Bridge Crossing
- 525 Country Glen Ct
- 535 Country Glen Ct
- 10510 Kingsmark Trail Unit 301
- 10510 Kingsmark Trail
- 630 Fieldwood Ln