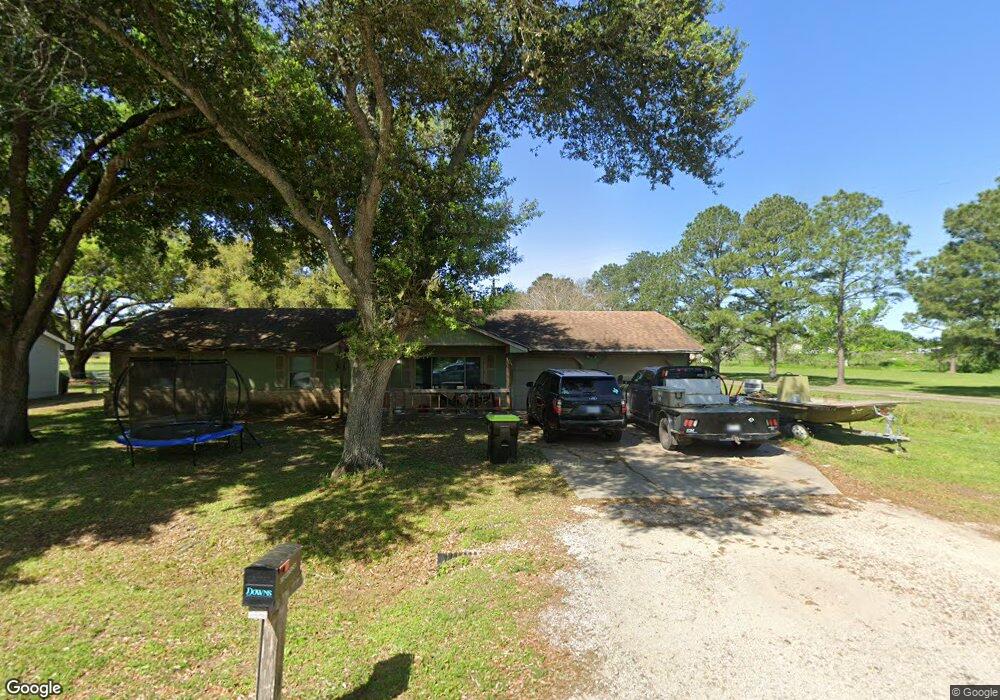
315 Lindsey Ave Bay City, TX 77414
Estimated Value: $153,284 - $242,000
3
Beds
2
Baths
1,155
Sq Ft
$171/Sq Ft
Est. Value
About This Home
This home is located at 315 Lindsey Ave, Bay City, TX 77414 and is currently estimated at $197,571, approximately $171 per square foot. 315 Lindsey Ave is a home located in Matagorda County with nearby schools including John H. Cherry Elementary School, Bay City Junior High School, and Bay City High School.
Ownership History
Date
Name
Owned For
Owner Type
Purchase Details
Closed on
Aug 25, 2021
Sold by
Bonifay Suzetta R and Bonifay Rudolph D
Bought by
Downs Cody and Downs Karissa
Current Estimated Value
Purchase Details
Closed on
Jan 8, 2010
Sold by
Salas Jason and Mattes Kristy C
Bought by
Downs Cody
Home Financials for this Owner
Home Financials are based on the most recent Mortgage that was taken out on this home.
Original Mortgage
$112,200
Interest Rate
4.8%
Mortgage Type
New Conventional
Purchase Details
Closed on
Jul 24, 2007
Sold by
Stuart Crysta Lynne
Bought by
Salas Jason and Matthes Kristy C
Home Financials for this Owner
Home Financials are based on the most recent Mortgage that was taken out on this home.
Original Mortgage
$83,686
Interest Rate
6.71%
Mortgage Type
FHA
Create a Home Valuation Report for This Property
The Home Valuation Report is an in-depth analysis detailing your home's value as well as a comparison with similar homes in the area
Home Values in the Area
Average Home Value in this Area
Purchase History
| Date | Buyer | Sale Price | Title Company |
|---|---|---|---|
| Downs Cody | -- | Bay City Abstract & Title Co | |
| Downs Cody | -- | None Available | |
| Salas Jason | -- | -- |
Source: Public Records
Mortgage History
| Date | Status | Borrower | Loan Amount |
|---|---|---|---|
| Previous Owner | Downs Cody | $112,200 | |
| Previous Owner | Salas Jason | $83,686 |
Source: Public Records
Tax History Compared to Growth
Tax History
| Year | Tax Paid | Tax Assessment Tax Assessment Total Assessment is a certain percentage of the fair market value that is determined by local assessors to be the total taxable value of land and additions on the property. | Land | Improvement |
|---|---|---|---|---|
| 2024 | $40 | $169,600 | $39,400 | $130,200 |
| 2023 | $3,595 | $156,330 | $30,170 | $126,160 |
| 2022 | $3,745 | $140,250 | $14,350 | $125,900 |
| 2021 | $3,955 | $138,400 | $14,350 | $124,050 |
| 2020 | $3,741 | $122,390 | $14,350 | $108,040 |
| 2019 | $3,730 | $122,100 | $14,350 | $107,750 |
| 2018 | $3,342 | $113,450 | $14,350 | $99,100 |
| 2017 | $3,236 | $115,890 | $14,350 | $101,540 |
| 2016 | $3,173 | $113,650 | $14,350 | $99,300 |
| 2015 | -- | $113,100 | $14,350 | $98,750 |
| 2014 | -- | $101,740 | $14,350 | $87,390 |
Source: Public Records
Map
Nearby Homes
- 710 Avenue F N
- 118 Cedar Vale Rd
- 1329 Adams Rd
- 0 Hwy 60 N Unit 778292
- 0 Hwy 60 N Unit 16149622
- 2200 Golden Ave
- 900 Avenue B
- 2809 La Mesa St
- 1100 Avenue C
- 2101 Merlin St
- 2616 El Camino St
- 2816 La Mesa St
- 1103 Brasfield St
- 1100 Gilbert Ave
- 1109 Avenue M
- 1211 Avenue M
- 4 Abalone St
- 1121 Avenue M
- 3 Columbella St
- 2801 Del Monte Ave
- 313 Lindsey Ave
- 316 Lindsey Ave
- 312 Lindsey Ave
- 309 Lindsey Ave
- 308 Lindsey Ave
- 307 Lindsey Ave
- 311 Ronald Ave
- 304 Lindsey Ave
- 1801 Pine Knoll Rd
- 321 Ronald Ave
- 309 Ronald Ave
- 1212 Lindsey Ave
- 301 Lindsey Ave
- 300 Lindsey Ave
- 303 Ronald Ave
- 0 Laura St
- 221 Avenue F
- 00 Ronald
- 109 Laura St
- 312 Ronald Ave