Estimated Value: $305,391 - $348,000
4
Beds
3
Baths
1,922
Sq Ft
$174/Sq Ft
Est. Value
About This Home
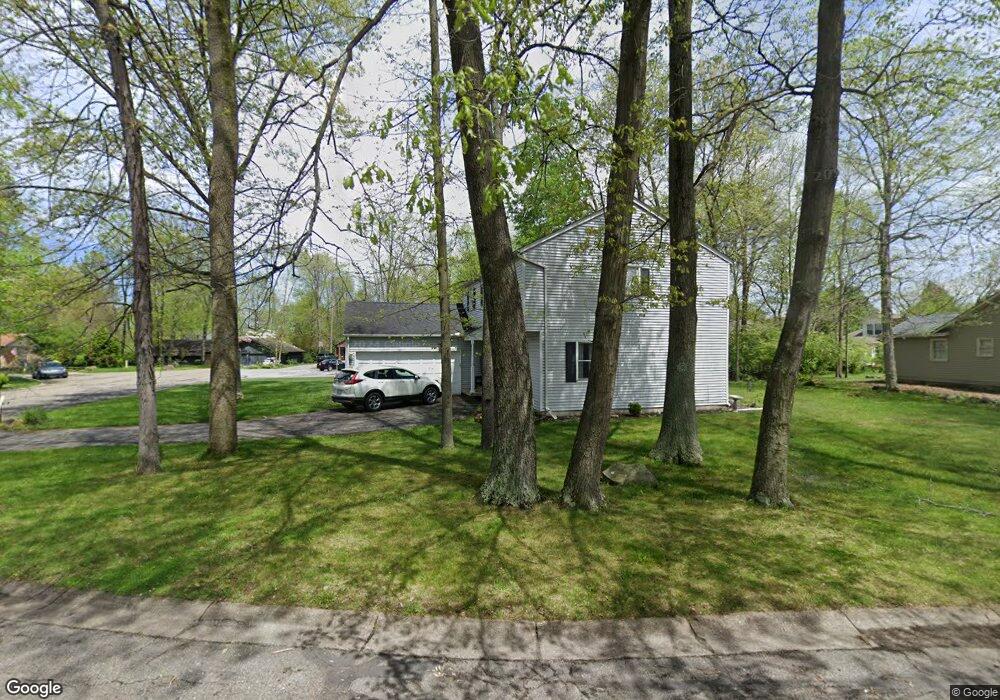
This home is located at 315 Locust View Way, Troy, OH 45373 and is currently estimated at $334,098, approximately $173 per square foot. 315 Locust View Way is a home located in Miami County with nearby schools including Concord Elementary School, Van Cleve Elementary School, and Troy Junior High School.
Ownership History
Date
Name
Owned For
Owner Type
Purchase Details
Closed on
Feb 8, 2012
Sold by
Secretary Of Housing & Urban Development
Bought by
Braham Alexander
Current Estimated Value
Purchase Details
Closed on
Sep 23, 2011
Sold by
Suntrust Mortgage Inc
Bought by
Secretary Of Housing & Urban Development
Purchase Details
Closed on
Jul 19, 2011
Sold by
Pierce Regina S
Bought by
Suntrust Mortgage Inc
Purchase Details
Closed on
Jul 10, 2003
Sold by
Seippel Nancy A
Bought by
Pierce Regina S
Purchase Details
Closed on
Aug 3, 1995
Sold by
Rasmussen Louis C
Bought by
Satterfield John E and Satterfield Ann M
Home Financials for this Owner
Home Financials are based on the most recent Mortgage that was taken out on this home.
Original Mortgage
$105,000
Interest Rate
7.56%
Mortgage Type
New Conventional
Create a Home Valuation Report for This Property
The Home Valuation Report is an in-depth analysis detailing your home's value as well as a comparison with similar homes in the area
Home Values in the Area
Average Home Value in this Area
Purchase History
| Date | Buyer | Sale Price | Title Company |
|---|---|---|---|
| Braham Alexander | -- | -- | |
| Secretary Of Housing & Urban Development | -- | -- | |
| Suntrust Mortgage Inc | $100,000 | -- | |
| Pierce Regina S | $153,000 | -- | |
| Satterfield John E | $135,000 | -- |
Source: Public Records
Mortgage History
| Date | Status | Borrower | Loan Amount |
|---|---|---|---|
| Previous Owner | Satterfield John E | $105,000 |
Source: Public Records
Tax History Compared to Growth
Tax History
| Year | Tax Paid | Tax Assessment Tax Assessment Total Assessment is a certain percentage of the fair market value that is determined by local assessors to be the total taxable value of land and additions on the property. | Land | Improvement |
|---|---|---|---|---|
| 2024 | $2,804 | $72,170 | $13,440 | $58,730 |
| 2023 | $2,804 | $72,170 | $13,440 | $58,730 |
| 2022 | $2,348 | $72,170 | $13,440 | $58,730 |
| 2021 | $2,085 | $60,130 | $11,200 | $48,930 |
| 2020 | $2,087 | $60,130 | $11,200 | $48,930 |
| 2019 | $2,106 | $60,130 | $11,200 | $48,930 |
| 2018 | $1,787 | $48,620 | $12,810 | $35,810 |
| 2017 | $1,804 | $48,620 | $12,810 | $35,810 |
| 2016 | $1,779 | $48,620 | $12,810 | $35,810 |
| 2015 | $1,713 | $45,020 | $11,870 | $33,150 |
| 2014 | $1,713 | $45,020 | $11,870 | $33,150 |
| 2013 | $1,724 | $45,020 | $11,870 | $33,150 |
Source: Public Records
Map
Nearby Homes
- 445 Wisteria Dr
- 2765 Silver Maple Ct
- 660 Wisteria Dr
- 203 Boone Dr
- 0 Lincolnshire Unit 939331
- 1701 Chevington Chase
- 2215 Merrimont Dr
- 1119 Honeydew Dr
- 1117 Honeydew Dr
- 1216 Wind Rock Ct
- 768 Stonehenge Dr
- Spruce Plan at Summit Landing
- Norway Plan at Summit Landing
- Chestnut Plan at Summit Landing
- Juniper Plan at Summit Landing
- Palmetto Plan at Summit Landing
- Ashton Plan at Summit Landing
- Empress Plan at Summit Landing
- Ironwood Plan at Summit Landing
- Aspen II Plan at Summit Landing
- 355 Locust View Way
- 295 Locust View Way
- 300 Locust View Way
- 375 Locust View Way
- 2900 Walnut Ridge Dr
- 350 Locust View Way
- 320 Locust View Way
- 290 Locust View Way
- 2892 Walnut Ridge Dr
- 340 Locust View Way
- 360 Locust View Way
- 2874 Walnut Ridge Dr
- 330 Locust View Way
- 270 Locust View Way
- 305 Green Oak Dr
- 325 Green Oak Dr
- 380 Locust View Way
- 295 Green Oak Dr
- 2860 Walnut Ridge Dr
- 390 Locust View Way