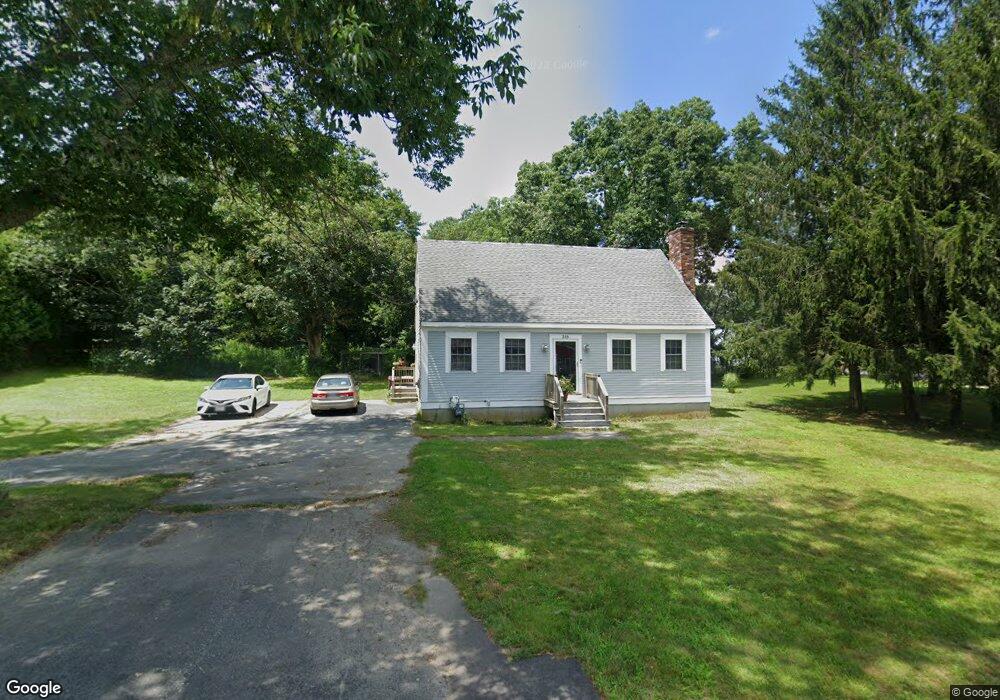
315 Main St Acushnet, MA 02743
Upper Acushnet NeighborhoodEstimated Value: $459,146 - $811,000
Studio
2
Baths
1,685
Sq Ft
$336/Sq Ft
Est. Value
About This Home
This home is located at 315 Main St, Acushnet, MA 02743 and is currently estimated at $566,287, approximately $336 per square foot. 315 Main St is a home located in Bristol County with nearby schools including Acushnet Elementary School, Albert F Ford Middle School, and Alma Del Mar Charter School.
Ownership History
Date
Name
Owned For
Owner Type
Purchase Details
Closed on
Mar 21, 2017
Sold by
Wylie Joyce A
Bought by
Joyce A Wylie Irt and Wylie
Current Estimated Value
Purchase Details
Closed on
Sep 23, 1986
Bought by
Wylie Joyce A
Create a Home Valuation Report for This Property
The Home Valuation Report is an in-depth analysis detailing your home's value as well as a comparison with similar homes in the area
Home Values in the Area
Average Home Value in this Area
Purchase History
| Date | Buyer | Sale Price | Title Company |
|---|---|---|---|
| Joyce A Wylie Irt | -- | -- | |
| Wylie Joyce A | -- | -- |
Source: Public Records
Mortgage History
| Date | Status | Borrower | Loan Amount |
|---|---|---|---|
| Previous Owner | Wylie Joyce A | $110,000 | |
| Previous Owner | Wylie Joyce A | $66,800 | |
| Previous Owner | Wylie Joyce A | $56,100 |
Source: Public Records
Tax History
| Year | Tax Paid | Tax Assessment Tax Assessment Total Assessment is a certain percentage of the fair market value that is determined by local assessors to be the total taxable value of land and additions on the property. | Land | Improvement |
|---|---|---|---|---|
| 2025 | $42 | $385,500 | $138,100 | $247,400 |
| 2024 | $4,045 | $354,500 | $130,800 | $223,700 |
| 2023 | $4,064 | $338,700 | $118,700 | $220,000 |
| 2022 | $4,022 | $303,100 | $111,500 | $191,600 |
| 2021 | $3,747 | $270,900 | $111,500 | $159,400 |
| 2020 | $3,675 | $263,600 | $104,200 | $159,400 |
| 2019 | $3,487 | $245,900 | $99,300 | $146,600 |
| 2018 | $3,381 | $234,500 | $99,300 | $135,200 |
| 2017 | $3,281 | $227,200 | $99,300 | $127,900 |
| 2016 | $3,342 | $230,000 | $99,300 | $130,700 |
| 2015 | $3,077 | $215,500 | $99,300 | $116,200 |
Source: Public Records
Map
Nearby Homes
Your Personal Tour Guide
Ask me questions while you tour the home.