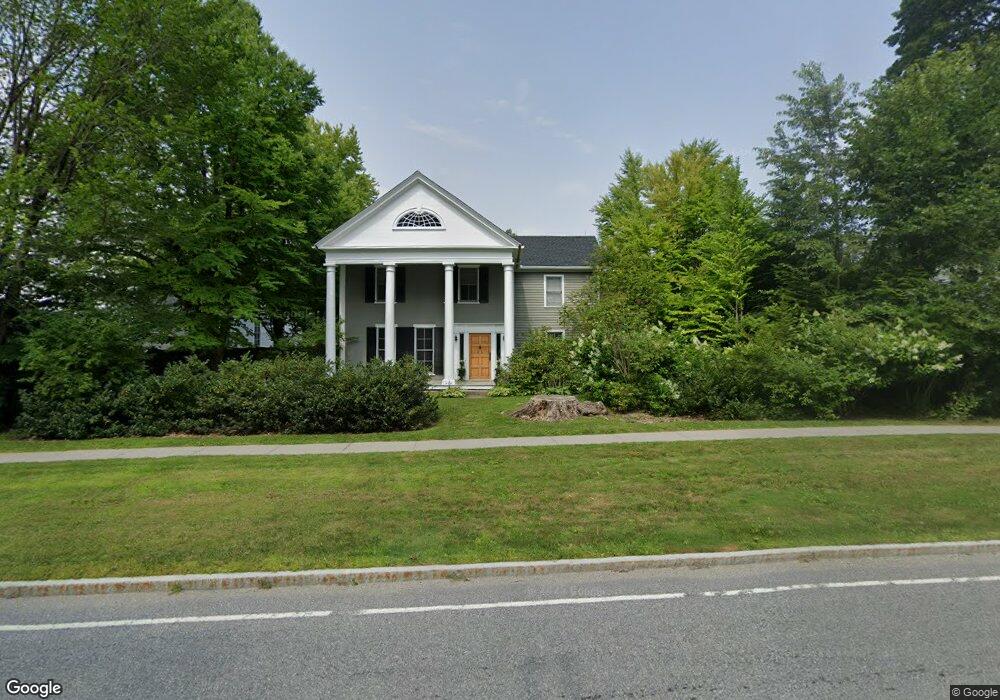
315 Main Stre Out of Area, CT 06039
Estimated Value: $934,645 - $1,758,000
4
Beds
3
Baths
4,310
Sq Ft
$273/Sq Ft
Est. Value
About This Home
This home is located at 315 Main Stre, Out of Area, CT 06039 and is currently estimated at $1,178,161, approximately $273 per square foot. 315 Main Stre is a home located in Litchfield County with nearby schools including Housatonic Valley Regional High School, Indian Mountain School, and The Hotchkiss School.
Ownership History
Date
Name
Owned For
Owner Type
Purchase Details
Closed on
Oct 10, 2024
Sold by
Douglas Robert H and Douglas Barbara
Bought by
Mayer Susan B and Mayer William A
Current Estimated Value
Home Financials for this Owner
Home Financials are based on the most recent Mortgage that was taken out on this home.
Original Mortgage
$365,000
Outstanding Balance
$361,163
Interest Rate
6.35%
Mortgage Type
Purchase Money Mortgage
Estimated Equity
$816,998
Purchase Details
Closed on
May 13, 2011
Sold by
Gorman Raymond J
Bought by
Douglas Robert H and Douglas Barbara
Purchase Details
Closed on
Jul 26, 2006
Sold by
Housatonic Mental Ctr
Bought by
Northwest Ctr Health I
Create a Home Valuation Report for This Property
The Home Valuation Report is an in-depth analysis detailing your home's value as well as a comparison with similar homes in the area
Home Values in the Area
Average Home Value in this Area
Purchase History
| Date | Buyer | Sale Price | Title Company |
|---|---|---|---|
| Mayer Susan B | $865,000 | None Available | |
| Mayer Susan B | $865,000 | None Available | |
| Mayer Susan B | $865,000 | None Available | |
| Douglas Robert H | -- | -- | |
| Northwest Ctr Health I | -- | -- | |
| Douglas Robert H | -- | -- | |
| Northwest Ctr Health I | -- | -- |
Source: Public Records
Mortgage History
| Date | Status | Borrower | Loan Amount |
|---|---|---|---|
| Open | Mayer Susan B | $365,000 | |
| Closed | Mayer Susan B | $365,000 | |
| Previous Owner | Northwest Ctr Health I | $950,000 |
Source: Public Records
Tax History Compared to Growth
Tax History
| Year | Tax Paid | Tax Assessment Tax Assessment Total Assessment is a certain percentage of the fair market value that is determined by local assessors to be the total taxable value of land and additions on the property. | Land | Improvement |
|---|---|---|---|---|
| 2025 | $5,939 | $539,900 | $175,100 | $364,800 |
| 2024 | $4,164 | $378,500 | $175,100 | $203,400 |
| 2023 | $4,164 | $378,500 | $175,100 | $203,400 |
| 2022 | $4,164 | $378,500 | $175,100 | $203,400 |
| 2021 | $4,164 | $378,500 | $175,100 | $203,400 |
| 2020 | $4,050 | $349,100 | $175,100 | $174,000 |
| 2019 | $4,050 | $349,100 | $175,100 | $174,000 |
| 2018 | $3,945 | $349,100 | $175,100 | $174,000 |
| 2017 | $3,875 | $349,100 | $175,100 | $174,000 |
| 2016 | $3,735 | $349,100 | $175,100 | $174,000 |
| 2015 | $3,378 | $315,700 | $175,100 | $140,600 |
| 2014 | $3,816 | $363,400 | $175,100 | $188,300 |
Source: Public Records
Map
Nearby Homes
- 308 Main St
- 21 Lakeview Ave
- 8 Holley St
- 21 Perry St
- 110 Sharon Rd
- 53 Upland Meadow Rd
- 40 Canterbury Ln
- 8 Tokone Hills Rd
- 0 Under Mountain Rd
- 0 Ore Hill Rd Unit 24132985
- 50 Main St
- 278 and 282 Farnum Rd
- 47 E Main St
- 24 Ore Hill Rd
- 0 Lime Rock Rd Unit 24116442
- 323 Wells Hill Rd
- 87 Canaan Rd Unit 6A
- 87 Canaan Rd Unit 2G
- 406 Wells Hill Rd
- 120 Lime Rock Rd