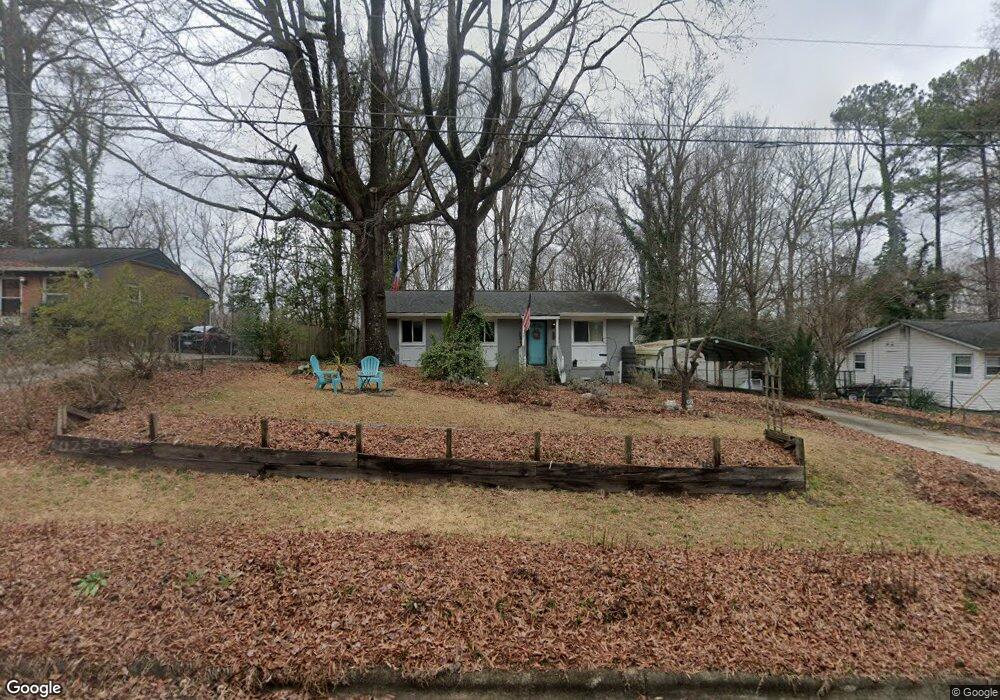
315 Maple St Cary, NC 27513
South Cary NeighborhoodEstimated Value: $300,000 - $424,000
3
Beds
2
Baths
992
Sq Ft
$367/Sq Ft
Est. Value
About This Home
This home is located at 315 Maple St, Cary, NC 27513 and is currently estimated at $364,174, approximately $367 per square foot. 315 Maple St is a home located in Wake County with nearby schools including Weatherstone Elementary School, East Cary Middle School, and Cary High School.
Ownership History
Date
Name
Owned For
Owner Type
Purchase Details
Closed on
Mar 11, 2021
Sold by
Favre Yannick
Bought by
Favre Yannick and Favre Meredith Mciver
Current Estimated Value
Purchase Details
Closed on
May 16, 2013
Sold by
Nabong Flora
Bought by
Favre Yannick
Home Financials for this Owner
Home Financials are based on the most recent Mortgage that was taken out on this home.
Original Mortgage
$121,125
Interest Rate
3.56%
Mortgage Type
New Conventional
Purchase Details
Closed on
Apr 4, 2005
Sold by
Gustafson Dennis and Gustafson Amanda F
Bought by
Nabong Pablo S and Nabong Flora
Home Financials for this Owner
Home Financials are based on the most recent Mortgage that was taken out on this home.
Original Mortgage
$110,026
Interest Rate
5.98%
Mortgage Type
FHA
Purchase Details
Closed on
May 28, 1999
Sold by
Lauderman Kenneth Dale
Bought by
Gustafson Dennis
Home Financials for this Owner
Home Financials are based on the most recent Mortgage that was taken out on this home.
Original Mortgage
$102,897
Interest Rate
6.84%
Mortgage Type
VA
Create a Home Valuation Report for This Property
The Home Valuation Report is an in-depth analysis detailing your home's value as well as a comparison with similar homes in the area
Home Values in the Area
Average Home Value in this Area
Purchase History
| Date | Buyer | Sale Price | Title Company |
|---|---|---|---|
| Favre Yannick | -- | None Available | |
| Favre Yannick | -- | None Listed On Document | |
| Favre Yannick | $127,500 | None Available | |
| Nabong Pablo S | $111,500 | -- | |
| Gustafson Dennis | $100,000 | -- |
Source: Public Records
Mortgage History
| Date | Status | Borrower | Loan Amount |
|---|---|---|---|
| Previous Owner | Favre Yannick | $121,125 | |
| Previous Owner | Nabong Pablo S | $110,026 | |
| Previous Owner | Gustafson Dennis | $102,897 |
Source: Public Records
Tax History
| Year | Tax Paid | Tax Assessment Tax Assessment Total Assessment is a certain percentage of the fair market value that is determined by local assessors to be the total taxable value of land and additions on the property. | Land | Improvement |
|---|---|---|---|---|
| 2025 | $2,892 | $335,141 | $205,000 | $130,141 |
| 2024 | $2,830 | $335,141 | $205,000 | $130,141 |
Source: Public Records
Map
Nearby Homes
- 507 Maple St
- 930 Madison Ave
- 101 Oscar Ln
- 103 Briarcreek Ct
- 316 Howland Ave
- 414 W Chatham St
- 412 W Chatham St
- 3020 Winfred Dell Ln
- 410 W Chatham St
- 415 W Chatham St
- 404 W Chatham St
- 413 W Chatham St
- 411 W Chatham St
- 509 Matheson Place
- 401 W Chatham St
- 117 Red Bud Ct
- 1017 Frank Page Dr
- 316 Williams St
- 223 Adams St
- 102 Joel Ct
- 313 Maple St
- 317 Maple St
- 309 Maple St
- 319 Maple St
- 523 Mayfair St
- 701 White Oak Dr
- 630 Madison Ave
- 318 Maple St
- 308 Maple St
- 602 Madison Ave
- 323 Maple St
- 700 Madison Ave
- 304 White Oak Dr
- 0 Maple St Unit 1904991
- 0 Maple St Unit 1940494
- 0 Maple St Unit 1873117
- 0 Maple St Unit 1621377
- 0 Maple St Unit 4 TR1940494
- 0 Maple St Unit 5 1621377
- 0 Maple St Unit 5 1873117
Your Personal Tour Guide
Ask me questions while you tour the home.