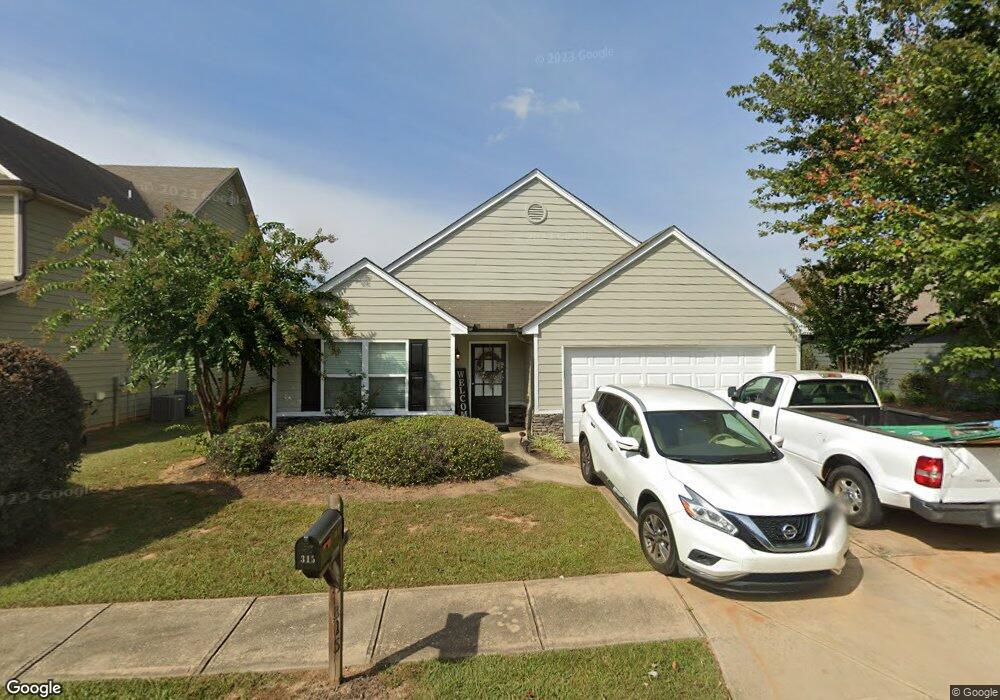
315 Meadow Vista Ln Unit 35 Hoschton, GA 30548
Estimated Value: $287,000 - $337,000
3
Beds
2
Baths
1,632
Sq Ft
$195/Sq Ft
Est. Value
About This Home
This home is located at 315 Meadow Vista Ln Unit 35, Hoschton, GA 30548 and is currently estimated at $318,435, approximately $195 per square foot. 315 Meadow Vista Ln Unit 35 is a home located in Jackson County with nearby schools including West Jackson Elementary School, West Jackson Middle School, and Jackson County High School.
Ownership History
Date
Name
Owned For
Owner Type
Purchase Details
Closed on
Feb 5, 2015
Sold by
Freo Georgia Llc
Bought by
Progress Residential 2015 1 Bo
Current Estimated Value
Home Financials for this Owner
Home Financials are based on the most recent Mortgage that was taken out on this home.
Original Mortgage
$558,681,024
Interest Rate
3.81%
Mortgage Type
New Conventional
Purchase Details
Closed on
Dec 19, 2012
Sold by
Cbna Ga Llc
Bought by
Freo Georgia Llc
Purchase Details
Closed on
Sep 4, 2012
Sold by
Grand Craft Homes Llc
Bought by
Certusbank
Purchase Details
Closed on
Apr 18, 2008
Sold by
Horizon Communities Llc
Bought by
Grand Graft Homes
Purchase Details
Closed on
Sep 12, 2005
Sold by
Georgia Real Estate Properties Inc
Bought by
Horizon Communities Llc
Create a Home Valuation Report for This Property
The Home Valuation Report is an in-depth analysis detailing your home's value as well as a comparison with similar homes in the area
Home Values in the Area
Average Home Value in this Area
Purchase History
| Date | Buyer | Sale Price | Title Company |
|---|---|---|---|
| Progress Residential 2015 1 Bo | -- | -- | |
| Freo Georgia Llc | $98,000 | -- | |
| Certusbank | -- | -- | |
| Grand Graft Homes | $58,000 | -- | |
| Horizon Communities Llc | $731,000 | -- |
Source: Public Records
Mortgage History
| Date | Status | Borrower | Loan Amount |
|---|---|---|---|
| Closed | Progress Residential 2015 1 Bo | $558,681,024 |
Source: Public Records
Tax History Compared to Growth
Tax History
| Year | Tax Paid | Tax Assessment Tax Assessment Total Assessment is a certain percentage of the fair market value that is determined by local assessors to be the total taxable value of land and additions on the property. | Land | Improvement |
|---|---|---|---|---|
| 2024 | $3,195 | $100,480 | $24,400 | $76,080 |
| 2023 | $3,195 | $92,160 | $24,400 | $67,760 |
| 2022 | $2,865 | $79,200 | $24,400 | $54,800 |
| 2021 | $2,289 | $70,800 | $16,000 | $54,800 |
| 2020 | $1,972 | $56,080 | $12,000 | $44,080 |
| 2019 | $2,008 | $56,080 | $12,000 | $44,080 |
| 2018 | $1,951 | $54,000 | $12,000 | $42,000 |
| 2017 | $1,945 | $53,443 | $12,000 | $41,443 |
| 2016 | $1,881 | $51,469 | $12,000 | $39,469 |
| 2015 | $1,658 | $45,199 | $4,800 | $40,399 |
| 2014 | $1,428 | $39,677 | $4,800 | $34,877 |
| 2013 | -- | $42,108 | $6,000 | $36,108 |
Source: Public Records
Map
Nearby Homes
- 315 Meadow Vista Ln
- 307 Meadow Vista Ln
- 307 Meadow Vista Ln
- 307 Meadow Vista Ln Unit 36
- 323 Meadow Vista Ln
- 323 Meadow Vista Ln Unit 34
- 331 Meadow Vista Ln
- 331 Meadow Vista Ln Unit 33
- 514 Amaranth Trail
- 524 Amaranth Trail
- 504 Amaranth Trail
- 316 Meadow Vista Ln
- 0 Muscogee Dr Unit 2972168
- 0 Muscogee Dr Unit 8973940
- 0 Muscogee Dr Unit 8006353
- 0 Muscogee Dr Unit 8245983
- 0 Muscogee Dr Unit 8364712
- 121 Muscogee Dr Unit 85
- 121 Muscogee Dr
- 308 Meadow Vista Ln Unit 1