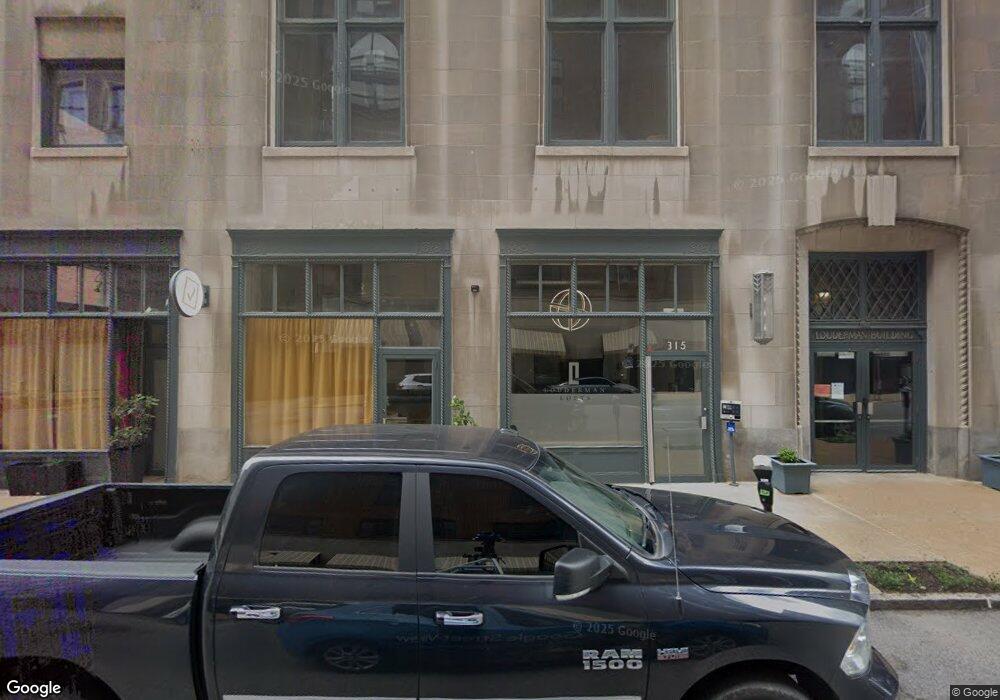
315 N 11th St Saint Louis, MO 63101
Downtown Saint Louis NeighborhoodEstimated Value: $336,800 - $394,000
--
Bed
2
Baths
2,214
Sq Ft
$164/Sq Ft
Est. Value
About This Home
This home is located at 315 N 11th St, Saint Louis, MO 63101 and is currently estimated at $362,200, approximately $163 per square foot. 315 N 11th St is a home located in St. Louis City with nearby schools including Peabody Elementary School, Vashon High School, and Atlas Elementary.
Ownership History
Date
Name
Owned For
Owner Type
Purchase Details
Closed on
Oct 27, 2020
Sold by
Amended Jeffrey M Couch and Amended Restated
Bought by
Peterson Jeffrey J and Peterson Nancy L
Current Estimated Value
Home Financials for this Owner
Home Financials are based on the most recent Mortgage that was taken out on this home.
Original Mortgage
$221,200
Outstanding Balance
$200,434
Interest Rate
3.87%
Mortgage Type
New Conventional
Estimated Equity
$161,766
Purchase Details
Closed on
Aug 1, 2017
Sold by
Studio Tangerine Llc
Bought by
Amended Jeffery M Couch and Revoc Restated
Purchase Details
Closed on
Nov 12, 2004
Sold by
Meyr Trae
Bought by
Resident Tangerine Llc
Purchase Details
Closed on
Mar 19, 2004
Sold by
Louderman Lofts Llc
Bought by
Meyr Trae D
Home Financials for this Owner
Home Financials are based on the most recent Mortgage that was taken out on this home.
Original Mortgage
$213,656
Interest Rate
4.75%
Mortgage Type
Purchase Money Mortgage
Create a Home Valuation Report for This Property
The Home Valuation Report is an in-depth analysis detailing your home's value as well as a comparison with similar homes in the area
Home Values in the Area
Average Home Value in this Area
Purchase History
| Date | Buyer | Sale Price | Title Company |
|---|---|---|---|
| Peterson Jeffrey J | $294,196 | Investors Title | |
| Peterson Jeffrey J | $276,500 | Investors Title Company | |
| Amended Jeffery M Couch | -- | None Available | |
| Resident Tangerine Llc | -- | -- | |
| Studio Tangerine Llc | -- | -- | |
| Meyr Trae D | -- | -- |
Source: Public Records
Mortgage History
| Date | Status | Borrower | Loan Amount |
|---|---|---|---|
| Open | Peterson Jeffrey J | $221,200 | |
| Closed | Peterson Jeffrey J | $221,200 | |
| Previous Owner | Meyr Trae D | $213,656 |
Source: Public Records
Tax History Compared to Growth
Tax History
| Year | Tax Paid | Tax Assessment Tax Assessment Total Assessment is a certain percentage of the fair market value that is determined by local assessors to be the total taxable value of land and additions on the property. | Land | Improvement |
|---|---|---|---|---|
| 2025 | $4,326 | $53,830 | -- | $53,830 |
| 2024 | $4,115 | $50,310 | -- | $50,310 |
| 2023 | $4,115 | $50,310 | $0 | $50,310 |
| 2022 | $4,136 | $48,370 | $0 | $48,370 |
| 2021 | $4,136 | $48,370 | $0 | $48,370 |
| 2020 | $4,140 | $48,370 | $0 | $48,370 |
| 2019 | $4,126 | $48,370 | $0 | $48,370 |
| 2018 | $4,251 | $48,370 | $0 | $48,370 |
| 2017 | $4,181 | $48,370 | $0 | $48,370 |
| 2016 | $4,056 | $46,270 | $0 | $46,270 |
| 2015 | $3,683 | $46,270 | $0 | $46,270 |
| 2014 | $3,671 | $46,270 | $0 | $46,270 |
| 2013 | -- | $46,270 | $0 | $46,270 |
Source: Public Records
Map
Nearby Homes
- 1112 Olive St
- 1113 Locust St Unit 300
- 1010 Saint Charles St Unit 602
- 1010 Saint Charles St Unit 502
- 1010 Saint Charles St Unit 1102
- 1010 Saint Charles St Unit 701
- 1010 Saint Charles St Unit 904
- 1010 Saint Charles St Unit 803
- 1136 Washington Ave Unit 201
- 1136 Washington Ave Unit 308
- 1136 Washington Ave Unit 502
- 1113 Washington Ave Unit 609
- 1113 Washington Ave Unit 713
- 1113 Washington Ave Unit 215
- 1113 Washington Ave Unit 312
- 1113 Washington Ave Unit 607
- 915 Olive St Unit 1203
- 915 Olive St Unit 1002
- 915 Olive St Unit 911
- 915 Olive St Unit 910