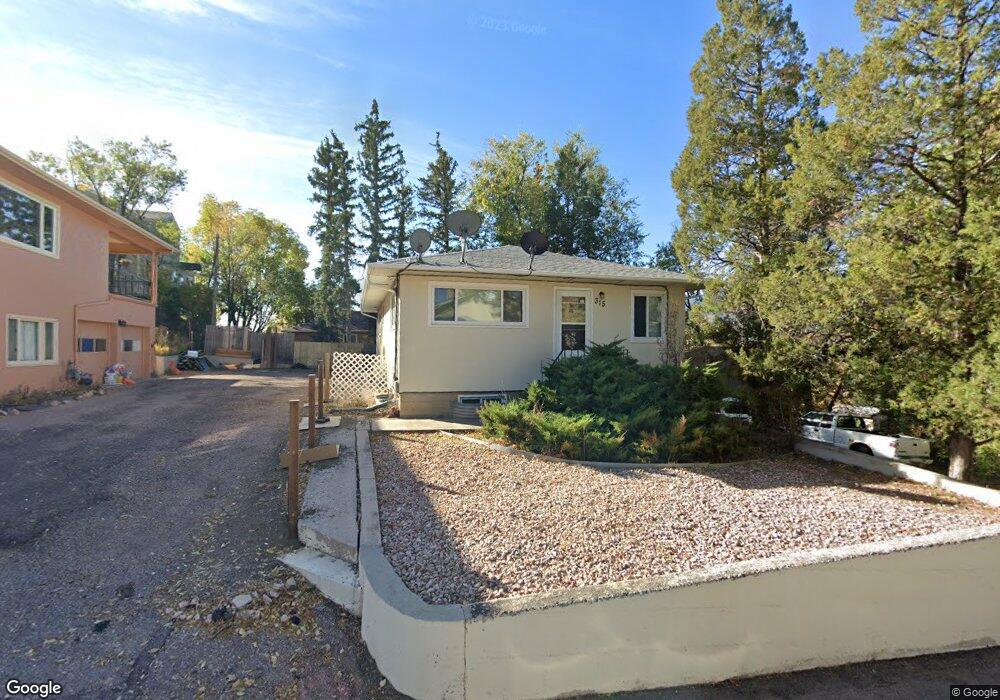
315 N 15th St Colorado Springs, CO 80904
Westside NeighborhoodEstimated Value: $339,000 - $470,000
3
Beds
2
Baths
864
Sq Ft
$470/Sq Ft
Est. Value
About This Home
This home is located at 315 N 15th St, Colorado Springs, CO 80904 and is currently estimated at $406,252, approximately $470 per square foot. 315 N 15th St is a home located in El Paso County with nearby schools including West Elementary School, West Middle School, and Coronado High School.
Ownership History
Date
Name
Owned For
Owner Type
Purchase Details
Closed on
Sep 17, 2009
Sold by
Bebber Thomas W Van and Bell Cynthia
Bought by
Bailey Steven P
Current Estimated Value
Home Financials for this Owner
Home Financials are based on the most recent Mortgage that was taken out on this home.
Original Mortgage
$194,900
Interest Rate
12%
Mortgage Type
Purchase Money Mortgage
Purchase Details
Closed on
May 12, 2008
Sold by
Vanbebber Thomas W
Bought by
Vanbebber Thomas W and Bell Cynthia
Home Financials for this Owner
Home Financials are based on the most recent Mortgage that was taken out on this home.
Original Mortgage
$133,000
Interest Rate
5.89%
Mortgage Type
New Conventional
Purchase Details
Closed on
Sep 28, 2007
Sold by
Vanbebber William G and Van Bebber Yvonne
Bought by
Vanbebber Thomas W
Purchase Details
Closed on
Sep 20, 1993
Bought by
Bailey Steven P
Purchase Details
Closed on
Sep 25, 1990
Bought by
Bailey Steven P
Purchase Details
Closed on
Feb 1, 1979
Bought by
Bailey Steven P
Create a Home Valuation Report for This Property
The Home Valuation Report is an in-depth analysis detailing your home's value as well as a comparison with similar homes in the area
Home Values in the Area
Average Home Value in this Area
Purchase History
| Date | Buyer | Sale Price | Title Company |
|---|---|---|---|
| Bailey Steven P | $178,750 | Security Title | |
| Vanbebber Thomas W | -- | Land Title | |
| Vanbebber Thomas W | -- | None Available | |
| Bailey Steven P | $6,000 | -- | |
| Bailey Steven P | $53,500 | -- | |
| Bailey Steven P | -- | -- |
Source: Public Records
Mortgage History
| Date | Status | Borrower | Loan Amount |
|---|---|---|---|
| Closed | Bailey Steven P | $194,900 | |
| Previous Owner | Vanbebber Thomas W | $133,000 |
Source: Public Records
Tax History Compared to Growth
Tax History
| Year | Tax Paid | Tax Assessment Tax Assessment Total Assessment is a certain percentage of the fair market value that is determined by local assessors to be the total taxable value of land and additions on the property. | Land | Improvement |
|---|---|---|---|---|
| 2025 | $1,296 | $23,850 | -- | -- |
| 2024 | $1,184 | $27,740 | $5,160 | $22,580 |
| 2022 | $1,159 | $20,720 | $3,570 | $17,150 |
| 2021 | $1,258 | $21,320 | $3,670 | $17,650 |
| 2020 | $1,232 | $18,150 | $3,120 | $15,030 |
| 2019 | $1,225 | $18,150 | $3,120 | $15,030 |
| 2018 | $1,059 | $14,430 | $2,880 | $11,550 |
| 2017 | $1,003 | $14,430 | $2,880 | $11,550 |
| 2016 | $815 | $14,050 | $3,180 | $10,870 |
| 2015 | $811 | $14,050 | $3,180 | $10,870 |
| 2014 | $769 | $12,780 | $2,870 | $9,910 |
Source: Public Records
Map
Nearby Homes
- 321 Graceland Grove
- 1509 W Platte Ave
- 23 N 15th St
- 1531 W Bijou St
- 135 Helena Ln
- 119 Helena Ln
- 1375 Talley Cir
- 1365 Talley Cir
- 585 Observatory Dr Unit 2F
- 1411 W Kiowa St
- 1345 Talley Cir
- 1355 Talley Cir
- 1522 Manitou Blvd
- 1609 W Kiowa St
- 1315 W Kiowa St
- 1502 Manitou Blvd
- 660 Pony Ln
- 1716 W Kiowa St
- 18 S 13th St
- 1709 W Pikes Peak Ave
- 317 N 15th St
- 307 N 15th St
- 1428 W Platte Ave
- 301 N 15th St
- 316 N 15th St
- 1426 W Platte Ave
- 312 N 15th St
- 320 N 15th St
- 355A Spring St
- 1512 W Platte Ave
- 330 Graceland Grove
- 1421 W Platte Ave
- 335 Graceland Grove
- 306 N 14th St
- 1425 W Platte Ave
- 1429 W Platte Ave
- 1404 W Platte Ave
- 1503 W Platte Ave
- 215 N 15th St
- 415 Spring St