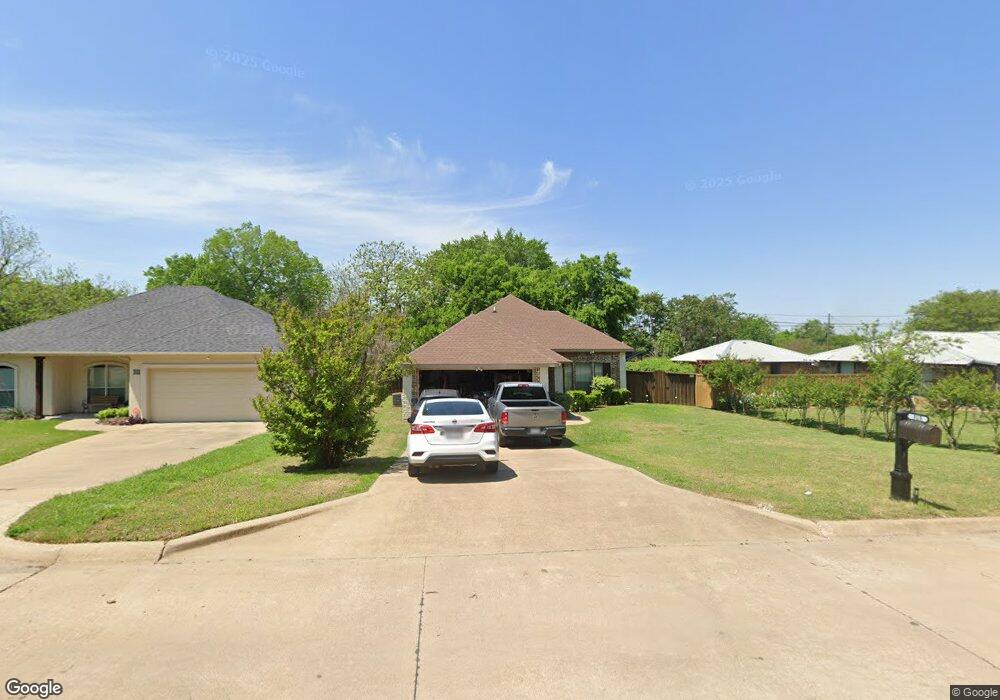
315 N 7th St Midlothian, TX 76065
Estimated Value: $294,013 - $303,000
3
Beds
2
Baths
1,586
Sq Ft
$188/Sq Ft
Est. Value
About This Home
This home is located at 315 N 7th St, Midlothian, TX 76065 and is currently estimated at $298,507, approximately $188 per square foot. 315 N 7th St is a home located in Ellis County with nearby schools including Irvin Elementary School and Frank Seale Middle School.
Ownership History
Date
Name
Owned For
Owner Type
Purchase Details
Closed on
Mar 31, 2015
Sold by
Pryor Shawna and Pryor Chris
Bought by
Pendleton Samuel L and Pendleton Jackie S
Current Estimated Value
Home Financials for this Owner
Home Financials are based on the most recent Mortgage that was taken out on this home.
Original Mortgage
$125,681
Outstanding Balance
$98,512
Interest Rate
4.25%
Mortgage Type
FHA
Estimated Equity
$199,995
Purchase Details
Closed on
Mar 30, 2007
Sold by
Sharp W C and Sharp Joyce
Bought by
Henderson Shawna
Home Financials for this Owner
Home Financials are based on the most recent Mortgage that was taken out on this home.
Original Mortgage
$129,500
Interest Rate
6.3%
Create a Home Valuation Report for This Property
The Home Valuation Report is an in-depth analysis detailing your home's value as well as a comparison with similar homes in the area
Home Values in the Area
Average Home Value in this Area
Purchase History
| Date | Buyer | Sale Price | Title Company |
|---|---|---|---|
| Pendleton Samuel L | -- | None Available | |
| Henderson Shawna | -- | None Available |
Source: Public Records
Mortgage History
| Date | Status | Borrower | Loan Amount |
|---|---|---|---|
| Open | Pendleton Samuel L | $125,681 | |
| Previous Owner | Henderson Shawna | $129,500 |
Source: Public Records
Tax History Compared to Growth
Tax History
| Year | Tax Paid | Tax Assessment Tax Assessment Total Assessment is a certain percentage of the fair market value that is determined by local assessors to be the total taxable value of land and additions on the property. | Land | Improvement |
|---|---|---|---|---|
| 2025 | $5,391 | $264,130 | $80,000 | $184,130 |
| 2024 | $5,391 | $267,189 | $80,000 | $187,189 |
| 2023 | $5,391 | $294,676 | $70,000 | $224,676 |
| 2022 | $5,023 | $224,176 | $37,500 | $186,676 |
| 2021 | $4,697 | $198,510 | $26,250 | $172,260 |
| 2020 | $4,767 | $189,520 | $26,250 | $163,270 |
| 2019 | $4,799 | $183,270 | $0 | $0 |
| 2018 | $4,653 | $177,660 | $20,000 | $157,660 |
| 2017 | $3,998 | $150,180 | $20,000 | $130,180 |
| 2016 | $3,638 | $136,690 | $15,000 | $121,690 |
| 2015 | $3,337 | $129,610 | $15,000 | $114,610 |
| 2014 | $3,337 | $125,380 | $0 | $0 |
Source: Public Records
Map
Nearby Homes