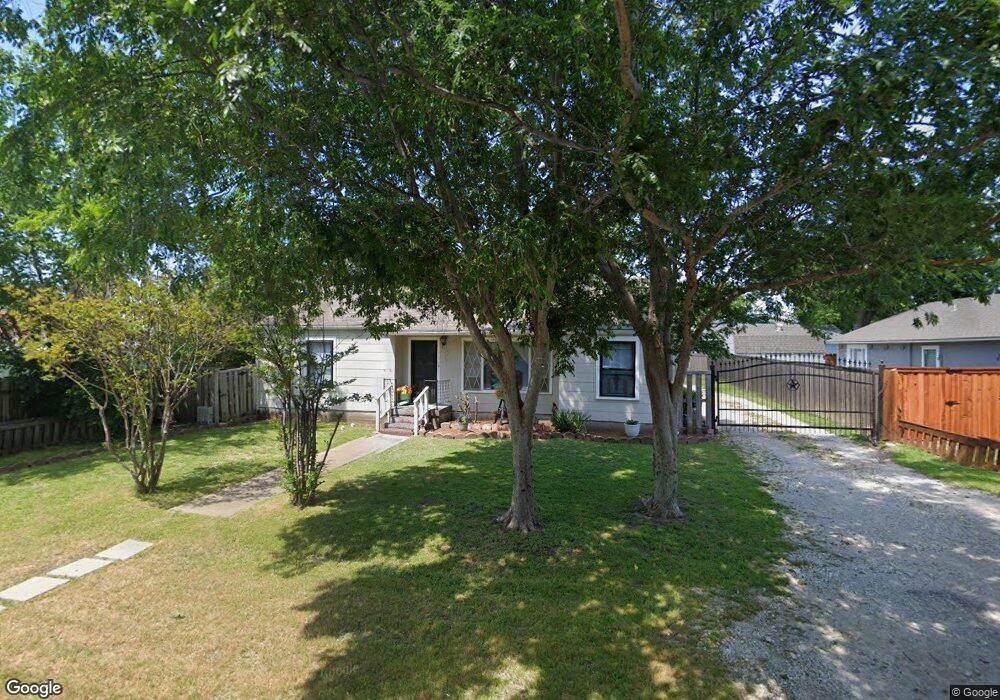
315 N 9th St Sanger, TX 76266
Estimated Value: $202,799 - $287,000
3
Beds
1
Bath
1,345
Sq Ft
$183/Sq Ft
Est. Value
About This Home
This home is located at 315 N 9th St, Sanger, TX 76266 and is currently estimated at $245,950, approximately $182 per square foot. 315 N 9th St is a home located in Denton County with nearby schools including Chisholm Trail Elementary School, Clear Creek Intermediate School, and Sanger Sixth Grade Campus.
Ownership History
Date
Name
Owned For
Owner Type
Purchase Details
Closed on
Oct 29, 2009
Sold by
Northstar Bank Of Texas
Bought by
Lane Edward E
Current Estimated Value
Home Financials for this Owner
Home Financials are based on the most recent Mortgage that was taken out on this home.
Original Mortgage
$59,850
Outstanding Balance
$38,862
Interest Rate
5.05%
Estimated Equity
$207,088
Purchase Details
Closed on
May 11, 2005
Sold by
Wachovia Bank Na
Bought by
Horton James
Purchase Details
Closed on
Oct 5, 2004
Sold by
Osoria Aureliano and Osoria Jennifer
Bought by
Wachovia Bank Na
Purchase Details
Closed on
Oct 17, 2001
Sold by
Otwell Roger
Bought by
Osoria Aureliano and Osoria Jennifer
Home Financials for this Owner
Home Financials are based on the most recent Mortgage that was taken out on this home.
Original Mortgage
$59,250
Interest Rate
6.84%
Create a Home Valuation Report for This Property
The Home Valuation Report is an in-depth analysis detailing your home's value as well as a comparison with similar homes in the area
Home Values in the Area
Average Home Value in this Area
Purchase History
| Date | Buyer | Sale Price | Title Company |
|---|---|---|---|
| Lane Edward E | -- | Title Resources | |
| Horton James | -- | Fidelity Natl Title Agency | |
| Wachovia Bank Na | $64,486 | -- | |
| Osoria Aureliano | -- | Alamo Title Company | |
| Osoria Aureliano | -- | Alamo Title Company |
Source: Public Records
Mortgage History
| Date | Status | Borrower | Loan Amount |
|---|---|---|---|
| Open | Lane Edward E | $59,850 | |
| Previous Owner | Osoria Aureliano | $59,250 | |
| Closed | Osoria Aureliano | $17,750 |
Source: Public Records
Tax History
| Year | Tax Paid | Tax Assessment Tax Assessment Total Assessment is a certain percentage of the fair market value that is determined by local assessors to be the total taxable value of land and additions on the property. | Land | Improvement |
|---|---|---|---|---|
| 2025 | $2,324 | $129,000 | $58,500 | $70,500 |
| 2024 | $2,324 | $115,000 | $52,588 | $62,412 |
| 2023 | $2,298 | $113,403 | $45,500 | $67,903 |
| 2022 | $2,883 | $130,000 | $35,750 | $94,250 |
| 2021 | $2,253 | $107,194 | $26,325 | $80,869 |
| 2020 | $2,076 | $93,807 | $29,250 | $64,557 |
| 2019 | $2,163 | $95,000 | $29,250 | $65,750 |
| 2018 | $1,682 | $73,500 | $29,250 | $44,250 |
| 2017 | $1,610 | $70,000 | $29,250 | $40,750 |
| 2016 | $1,452 | $63,141 | $16,250 | $46,891 |
| 2015 | -- | $55,000 | $16,250 | $38,750 |
| 2013 | -- | $60,000 | $16,250 | $43,750 |
Source: Public Records
Map
Nearby Homes
- 412 N 10th St
- 612 N 10th St
- 1209 Bolivar St
- 4551 Farm To Market Road 455
- 2164 Farm To Market Road 455
- 710 W Willow St
- 411 Hughes St
- 500 W Willow St
- 4063 Farm To Market 455 W
- TBD Church St
- Tbd Church St
- 1149 Serendipity Cir
- Tbd I-35
- 307 Railroad Ave
- 309 Railroad Ave
- 102 E Willow St
- 403 S 1st St
- 20 Grouse Cir
- 6 Grouse Cir
- 113 Diane Dr
- 317 N 9th St
- 906 Elm St Unit 3
- 901 Bolivar St
- 911 Bolivar St
- 811 Bolivar St
- 908 Elm St
- 913 Bolivar St
- 903 Elm St Unit 6
- 905 Elm St
- 803 Bolivar St
- 907 Elm St
- 805 Elm St
- 902 Bolivar St
- 317 N 10th St
- 912 Bolivar St
- 1003 Bolivar St
- 801 Elm St Unit 803
- 801 Elm St Unit A
- 801 Elm St Unit B UPPER
- 801 Elm St Unit B
Your Personal Tour Guide
Ask me questions while you tour the home.