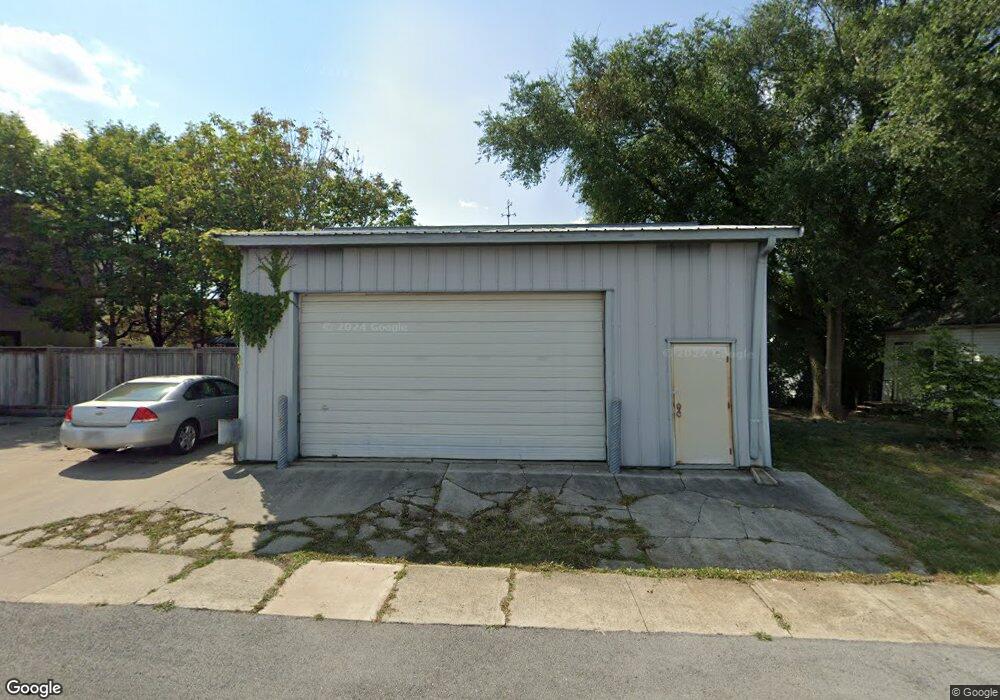
315 N Baxter St Lima, OH 45801
Central Lima NeighborhoodEstimated Value: $49,000 - $196,000
Studio
--
Bath
900
Sq Ft
$120/Sq Ft
Est. Value
About This Home
This home is located at 315 N Baxter St, Lima, OH 45801 and is currently estimated at $108,333, approximately $120 per square foot. 315 N Baxter St is a home located in Allen County with nearby schools including Heritage Elementary School, Lima North Middle School, and Lima West Middle School.
Ownership History
Date
Name
Owned For
Owner Type
Purchase Details
Closed on
Feb 2, 2024
Sold by
Reinicke Daniel E and Reinicke Patricia K
Bought by
Rice Chad Allen
Current Estimated Value
Home Financials for this Owner
Home Financials are based on the most recent Mortgage that was taken out on this home.
Original Mortgage
$281,250
Outstanding Balance
$247,352
Interest Rate
7.29%
Mortgage Type
Credit Line Revolving
Estimated Equity
-$139,019
Purchase Details
Closed on
Jan 5, 2024
Sold by
Ritchie Thomas D
Bought by
Reinicke Daniel E and Reinicke Patricia K
Home Financials for this Owner
Home Financials are based on the most recent Mortgage that was taken out on this home.
Original Mortgage
$281,250
Outstanding Balance
$247,352
Interest Rate
7.29%
Mortgage Type
Credit Line Revolving
Estimated Equity
-$139,019
Purchase Details
Closed on
Sep 9, 2002
Sold by
Mcclain Rodger L
Bought by
Ritchie Thomas
Purchase Details
Closed on
May 22, 1985
Bought by
Mcclain Rodger L
Create a Home Valuation Report for This Property
The Home Valuation Report is an in-depth analysis detailing your home's value as well as a comparison with similar homes in the area
Home Values in the Area
Average Home Value in this Area
Purchase History
| Date | Buyer | Sale Price | Title Company |
|---|---|---|---|
| Rice Chad Allen | -- | None Listed On Document | |
| Reinicke Daniel E | $360,000 | None Listed On Document | |
| Ritchie Thomas | $20,000 | -- | |
| Mcclain Rodger L | $2,500 | -- |
Source: Public Records
Mortgage History
| Date | Status | Borrower | Loan Amount |
|---|---|---|---|
| Open | Reinicke Daniel E | $281,250 |
Source: Public Records
Tax History
| Year | Tax Paid | Tax Assessment Tax Assessment Total Assessment is a certain percentage of the fair market value that is determined by local assessors to be the total taxable value of land and additions on the property. | Land | Improvement |
|---|---|---|---|---|
| 2024 | $165 | $2,770 | $1,440 | $1,330 |
| 2023 | $225 | $2,630 | $1,370 | $1,260 |
| 2022 | $172 | $2,630 | $1,370 | $1,260 |
| 2021 | $179 | $2,630 | $1,370 | $1,260 |
| 2020 | $151 | $3,120 | $1,300 | $1,820 |
| 2019 | $151 | $3,120 | $1,300 | $1,820 |
| 2018 | $151 | $3,120 | $1,300 | $1,820 |
| 2017 | $152 | $3,120 | $1,300 | $1,820 |
| 2016 | $156 | $3,120 | $1,300 | $1,820 |
| 2015 | $158 | $3,120 | $1,300 | $1,820 |
| 2014 | $183 | $3,610 | $1,330 | $2,280 |
| 2013 | $178 | $3,610 | $1,330 | $2,280 |
Source: Public Records
Map
Nearby Homes
- 508 N Collett St
- 745 Richie Ave
- 3 House Package
- 431 N Metcalf St
- 631 Brice Ave
- 615 N Collett St
- 809 Rice Ave
- 555 Haller St
- 618 Woodward Ave
- 703 N Collett St
- 325 N McDonel St
- 210 S Baxter St
- 503 N Charles St
- 513 N Charles St
- 1023 Brice Ave
- 631 Hazel Ave
- 1027 Brice Ave
- 625 N Charles St
- 956 Rice Ave
- 638 Hazel Ave
Your Personal Tour Guide
Ask me questions while you tour the home.