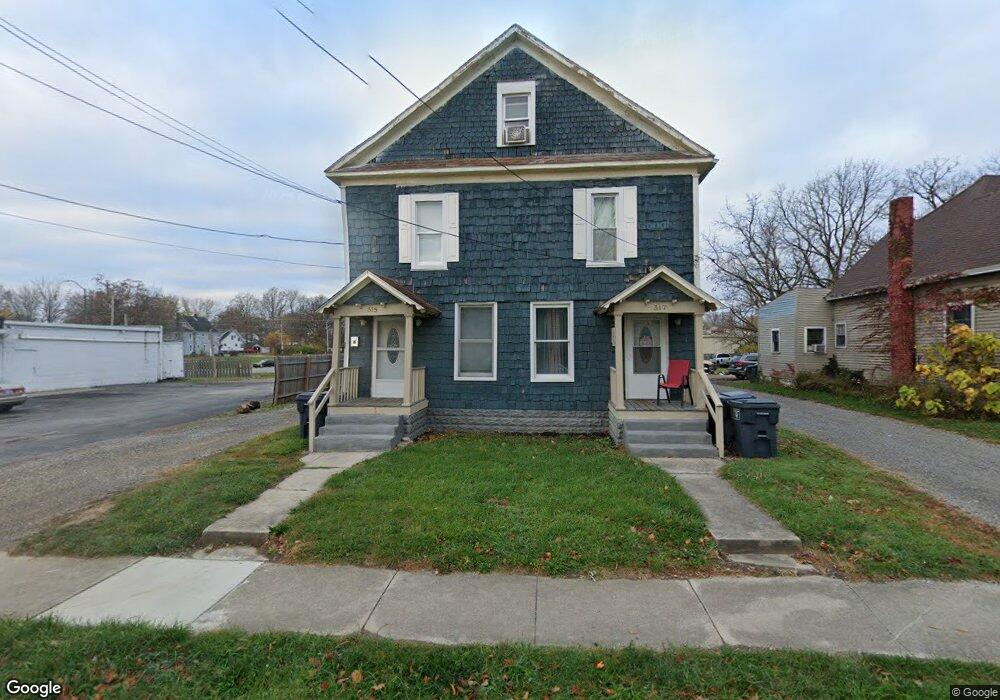
315 N Charles St Lima, OH 45805
Central Lima NeighborhoodEstimated Value: $37,408 - $152,000
4
Beds
2
Baths
2,585
Sq Ft
$38/Sq Ft
Est. Value
About This Home
This home is located at 315 N Charles St, Lima, OH 45805 and is currently estimated at $99,102, approximately $38 per square foot. 315 N Charles St is a home located in Allen County with nearby schools including Heritage Elementary School, Lima West Middle School, and Lima North Middle School.
Ownership History
Date
Name
Owned For
Owner Type
Purchase Details
Closed on
Jan 26, 2019
Sold by
Samuel Phillip Properties Llc
Bought by
Md Investing Ltd
Current Estimated Value
Purchase Details
Closed on
Feb 28, 2018
Sold by
Bullock Michael O and Bullock Sandra J
Bought by
Samuel Phillip Properties Llc
Purchase Details
Closed on
Mar 4, 2016
Sold by
Bullock Michael O
Bought by
Samuel Phillip Properties Llc
Purchase Details
Closed on
Oct 22, 2015
Sold by
Walker Juanita L and Allen County Treasurer
Bought by
Bullock Michael O
Purchase Details
Closed on
May 5, 1997
Sold by
Hites Brian
Bought by
Plikerd Russell
Home Financials for this Owner
Home Financials are based on the most recent Mortgage that was taken out on this home.
Original Mortgage
$22,000
Interest Rate
8.05%
Mortgage Type
New Conventional
Purchase Details
Closed on
May 6, 1993
Sold by
Twining Loren A
Bought by
Hites Brian K and Plikerd Russell T
Purchase Details
Closed on
Sep 1, 1983
Bought by
Twining Loren A
Create a Home Valuation Report for This Property
The Home Valuation Report is an in-depth analysis detailing your home's value as well as a comparison with similar homes in the area
Home Values in the Area
Average Home Value in this Area
Purchase History
| Date | Buyer | Sale Price | Title Company |
|---|---|---|---|
| Md Investing Ltd | $21,000 | None Available | |
| Samuel Phillip Properties Llc | -- | None Available | |
| Samuel Phillip Properties Llc | -- | None Available | |
| Bullock Michael O | $9,000 | None Available | |
| Plikerd Russell | $13,850 | -- | |
| Hites Brian K | $22,000 | -- | |
| Twining Loren A | $15,000 | -- |
Source: Public Records
Mortgage History
| Date | Status | Borrower | Loan Amount |
|---|---|---|---|
| Previous Owner | Plikerd Russell | $22,000 |
Source: Public Records
Tax History Compared to Growth
Tax History
| Year | Tax Paid | Tax Assessment Tax Assessment Total Assessment is a certain percentage of the fair market value that is determined by local assessors to be the total taxable value of land and additions on the property. | Land | Improvement |
|---|---|---|---|---|
| 2024 | $743 | $19,320 | $2,380 | $16,940 |
| 2023 | $804 | $18,420 | $2,280 | $16,140 |
| 2022 | $807 | $18,420 | $2,280 | $16,140 |
| 2021 | $855 | $18,420 | $2,280 | $16,140 |
| 2020 | $479 | $16,880 | $2,210 | $14,670 |
| 2019 | $479 | $8,550 | $2,210 | $6,340 |
| 2018 | $736 | $14,010 | $2,210 | $11,800 |
| 2017 | $746 | $14,010 | $2,210 | $11,800 |
| 2016 | $756 | $14,010 | $2,210 | $11,800 |
| 2015 | $841 | $14,010 | $2,210 | $11,800 |
| 2014 | $841 | $14,460 | $2,240 | $12,220 |
| 2013 | $820 | $14,460 | $2,240 | $12,220 |
Source: Public Records
Map
Nearby Homes
- 1036 W High St
- 1120 Richie Ave
- 618 Woodward Ave
- 1023 Leland Ave
- 1206 Rice Ave
- 745 Brice Ave
- 343 S Charles St
- 233 S Kenilworth Ave
- 631 Hazel Ave
- 705 W Elm St
- 648 Hazel Ave
- 638 Hazel Ave
- 627 Brice Ave
- 1517 Allentown Rd
- 120 S Woodlawn Ave
- 419 S Collett St
- 612 N Metcalf St
- 434 N Washington St
- 426 S Baxter St
- 427 S Kenilworth Ave
- 325 N Charles St
- 327 N Charles St
- 324 N Charles St
- 996 W North St
- 329 N Charles St
- 994 W North St
- 331 N Charles St
- 331 N Charles St
- 1028 W North St
- 326 N Charles St
- 335 N Charles St
- 335 N Charles St
- 980 W North St
- 000 W North St
- 330 N Charles St
- 330 N Charles St
- 339 N Charles St
- 339 N Charles St
- 1019 W North St
- 318 N Jameson Ave