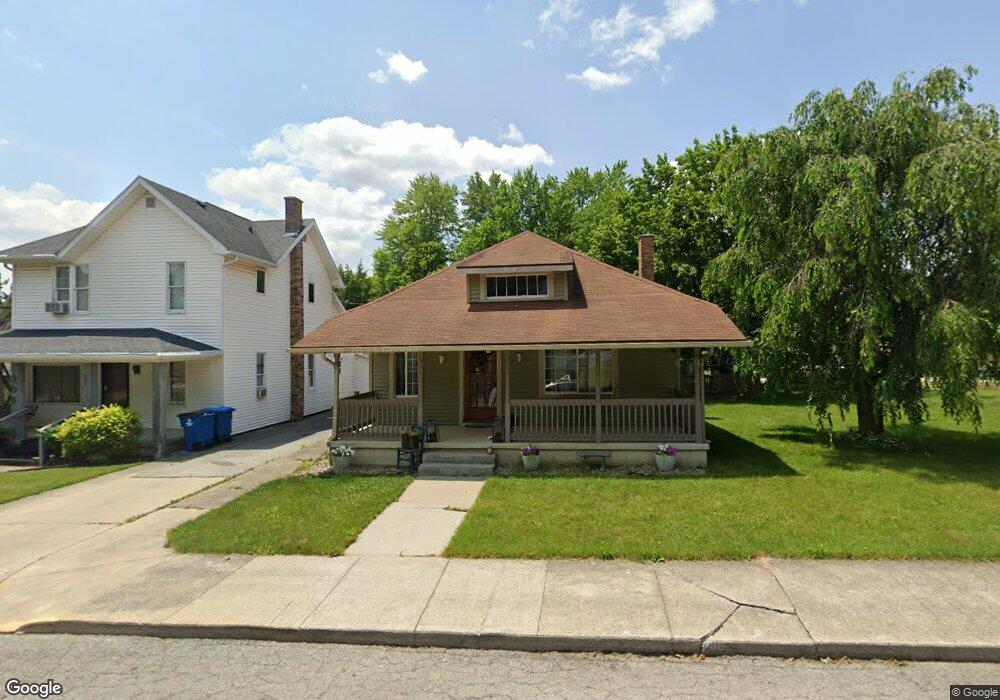
315 N Lee St Markle, IN 46770
Estimated Value: $129,000 - $158,000
3
Beds
1
Bath
2,830
Sq Ft
$51/Sq Ft
Est. Value
About This Home
This home is located at 315 N Lee St, Markle, IN 46770 and is currently estimated at $143,274, approximately $50 per square foot. 315 N Lee St is a home located in Huntington County with nearby schools including Salamonie School and Huntington North High School.
Ownership History
Date
Name
Owned For
Owner Type
Purchase Details
Closed on
May 17, 2024
Sold by
Sizemore Jessica E
Bought by
Carter Richard W and Carter Dawn R
Current Estimated Value
Home Financials for this Owner
Home Financials are based on the most recent Mortgage that was taken out on this home.
Original Mortgage
$99,300
Outstanding Balance
$97,519
Interest Rate
6.82%
Mortgage Type
New Conventional
Estimated Equity
$45,755
Purchase Details
Closed on
May 31, 2022
Sold by
Bowman William J and Bowman Patricia L
Bought by
Sizemore Jessica E
Home Financials for this Owner
Home Financials are based on the most recent Mortgage that was taken out on this home.
Original Mortgage
$109,250
Interest Rate
5%
Mortgage Type
New Conventional
Purchase Details
Closed on
May 25, 2007
Sold by
Roberts Lawrence Kay and Roberts Karen Kay
Bought by
Bowman William J and Bowman Patricia L
Create a Home Valuation Report for This Property
The Home Valuation Report is an in-depth analysis detailing your home's value as well as a comparison with similar homes in the area
Purchase History
| Date | Buyer | Sale Price | Title Company |
|---|---|---|---|
| Carter Richard W | $125,300 | Fidelity National Title | |
| Sizemore Jessica E | $115,000 | Garwood Max | |
| Bowman William J | -- | None Available |
Source: Public Records
Mortgage History
| Date | Status | Borrower | Loan Amount |
|---|---|---|---|
| Open | Carter Richard W | $99,300 | |
| Previous Owner | Sizemore Jessica E | $109,250 |
Source: Public Records
Tax History
| Year | Tax Paid | Tax Assessment Tax Assessment Total Assessment is a certain percentage of the fair market value that is determined by local assessors to be the total taxable value of land and additions on the property. | Land | Improvement |
|---|---|---|---|---|
| 2024 | $1,343 | $134,300 | $9,500 | $124,800 |
| 2023 | $1,141 | $116,900 | $9,500 | $107,400 |
| 2022 | $936 | $106,900 | $9,500 | $97,400 |
| 2021 | $1,744 | $87,200 | $9,500 | $77,700 |
| 2020 | $1,570 | $78,500 | $9,500 | $69,000 |
| 2019 | $1,454 | $72,700 | $9,500 | $63,200 |
| 2018 | $1,454 | $72,700 | $9,500 | $63,200 |
| 2017 | $1,022 | $51,100 | $9,500 | $41,600 |
| 2016 | $982 | $49,100 | $9,500 | $39,600 |
| 2014 | $944 | $47,200 | $9,500 | $37,700 |
| 2013 | $944 | $48,000 | $9,500 | $38,500 |
Source: Public Records
Map
Nearby Homes
Your Personal Tour Guide
Ask me questions while you tour the home.