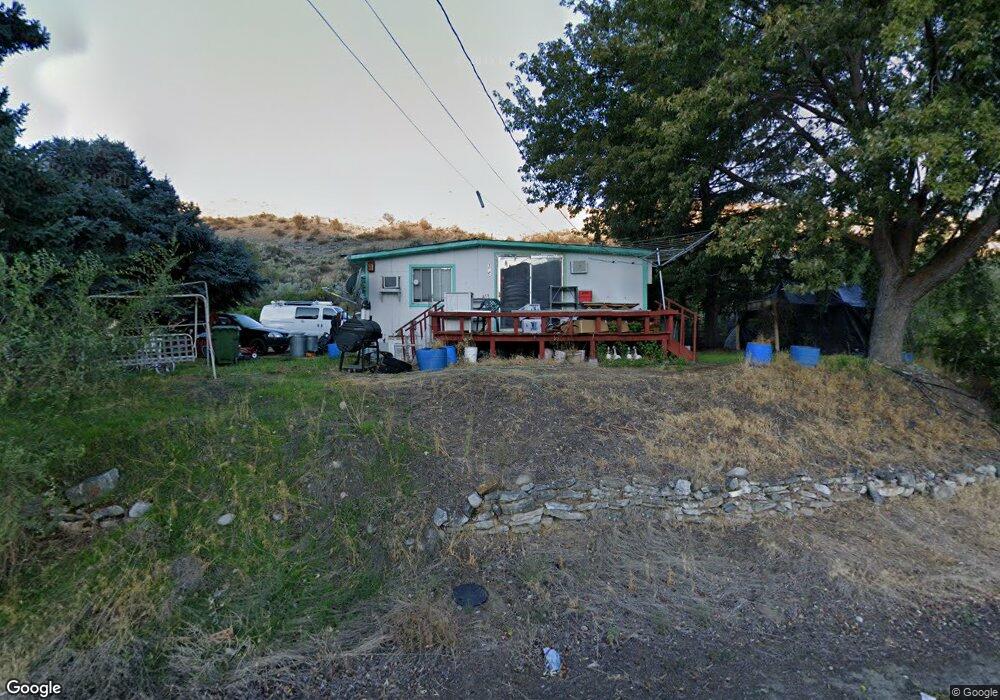
315 N Main St Riverside, WA 98849
Estimated Value: $107,850 - $275,000
2
Beds
1
Bath
766
Sq Ft
$227/Sq Ft
Est. Value
About This Home
This home is located at 315 N Main St, Riverside, WA 98849 and is currently estimated at $173,713, approximately $226 per square foot. 315 N Main St is a home located in Okanogan County with nearby schools including North Omak Elementary School, East Omak Elementary School, and Omak Middle School.
Ownership History
Date
Name
Owned For
Owner Type
Purchase Details
Closed on
Jun 6, 2025
Sold by
Tincher Cole H
Bought by
Crofoot Joshua R
Current Estimated Value
Purchase Details
Closed on
Jan 19, 2021
Sold by
Tincher James
Bought by
Tincher Cole H
Create a Home Valuation Report for This Property
The Home Valuation Report is an in-depth analysis detailing your home's value as well as a comparison with similar homes in the area
Home Values in the Area
Average Home Value in this Area
Purchase History
| Date | Buyer | Sale Price | Title Company |
|---|---|---|---|
| Crofoot Joshua R | $30,000 | None Listed On Document | |
| Tincher Cole H | -- | None Available |
Source: Public Records
Tax History Compared to Growth
Tax History
| Year | Tax Paid | Tax Assessment Tax Assessment Total Assessment is a certain percentage of the fair market value that is determined by local assessors to be the total taxable value of land and additions on the property. | Land | Improvement |
|---|---|---|---|---|
| 2025 | $602 | $69,300 | $9,800 | $59,500 |
| 2024 | $602 | $69,300 | $9,800 | $59,500 |
| 2023 | $559 | $57,000 | $9,800 | $47,200 |
| 2022 | $569 | $50,800 | $9,800 | $41,000 |
| 2021 | $490 | $50,800 | $9,800 | $41,000 |
| 2020 | $6 | $41,300 | $9,800 | $31,500 |
| 2019 | $6 | $41,300 | $9,800 | $31,500 |
| 2018 | $0 | $41,300 | $9,800 | $31,500 |
| 2017 | $0 | $41,300 | $9,800 | $31,500 |
| 2016 | -- | $41,300 | $9,800 | $31,500 |
| 2015 | -- | $37,200 | $9,800 | $27,400 |
| 2013 | -- | $37,200 | $9,800 | $27,400 |
Source: Public Records
Map
Nearby Homes
- 301 N Main St
- 210 1st St
- 105 Lower Tower St
- 0 Tbd Pharr Out - 3 Way Unit NWM2413618
- 158 Riverside Cutoff Rd
- 0 570X Tunk Creek Rd
- 0 TBD Seahawk Dr
- 0 Tbd Pharr Out - 9 Way
- 0 Way
- 0 Tbd Pharr Out - 11 Way
- 0 Tbd Pharr Out - 7 Way
- 0 Tbd Pharr Out - 2 Way
- 0 Way
- 105 Greenacres Rd
- 212 Hubbard Rd
- 0 Tbd Pharr Out - 15 Way
- 0 Tbd Pharr Out - 16 Way
- 0 Tbd Pharr Out - 13 Way
- 33 Greenacres Rd
- 0 Tbd Pharr Out Way - 4
- 313 N Main St
- 29935 Highway 97
- 309A N Main St
- 309 N Main St
- 309A N Main St
- 0 U S 97
- 101 Glenwood Ave
- 301 N Main St
- 101 Riverside St
- 2 XX Riverside St
- 0 Lot 5 Riverside St
- 0 Lot 4 Riverside St
- 2 XX Riverisde Mt Olive Estates
- 103 Riverside St
- 201 Glenwood Ave
- 101 West St
- 205 N Main St
- 202 N Main St
- 113 Tower Rd
- 113 Tower St