
Seller's Agent in 2025
Burton Wilkins
GOLDCOAST SOTHEBY'S INTERNATIONAL REALTY
(609) 513-2500
20 in this area
189 Total Sales
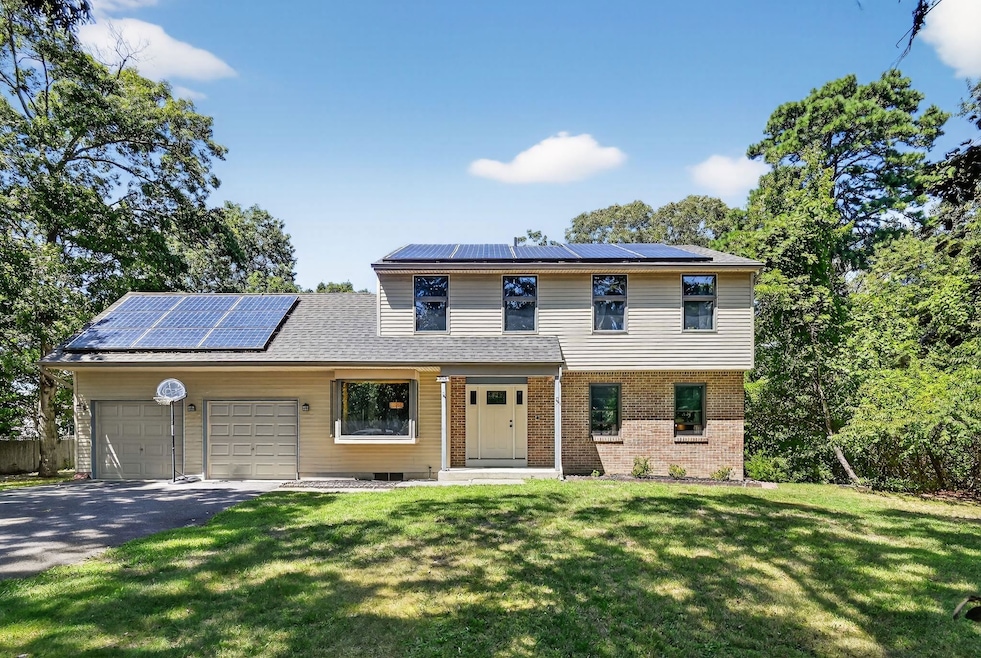
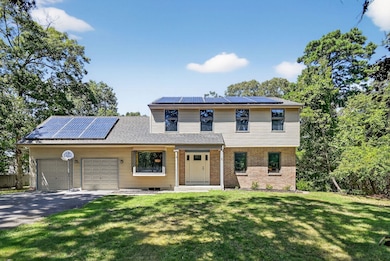
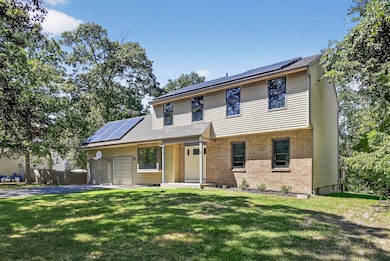
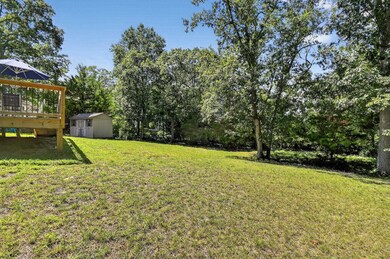
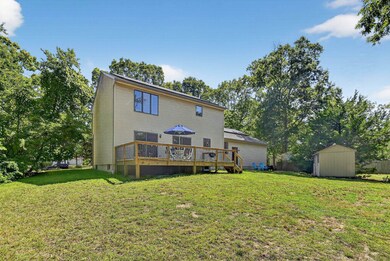
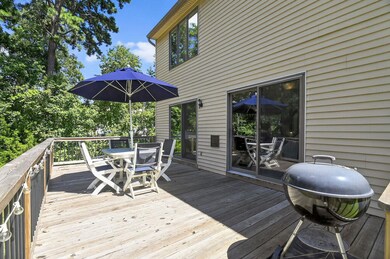
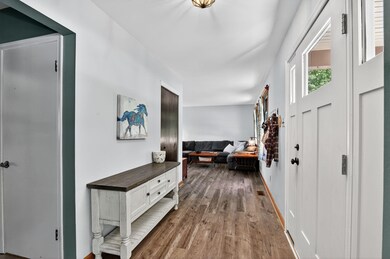
Welcome to this lovely 3-bedroom, 2.5-bath colonial home nestled in an established neighborhood just minutes from Garden State Parkway Exit25, shopping, and the beautiful beaches of Ocean City. Step onto the inviting covered front porch and into the foyer, where you’ll find a spacious living room, an eat-in kitchen with stainless steel appliances, a separate dining room, and a convenient powder room—all on the first floor. The living area flows seamlessly to a large rear deck, perfect for entertaining, and overlooks a private backyard with mature trees. Upstairs, the second floor offers three comfortable bedrooms and two full baths, including a primary suite with a recently updated bathroom. A laundry closet on this level adds everyday convenience. The home also features a full basement, housing the geothermal HVAC system, water treatment system, and providing abundant storage or recreational space. Additional highlights include Andersen windows, new flooring, and recently upgraded electric service designed to accommodate charging a hybrid or electric vehicle in the attached two-car garage. Extra storage is available in the garage attic with pull-down stairs and in the backyard shed. There is an electric fence for your pets. This property combines comfort, efficiency, and convenience—all in a desirable location. Call today to schedule your private showing.
Last Agent to Sell the Property
GOLDCOAST SOTHEBY'S INTERNATIONAL REALTY License #8743449 Listed on: 08/30/2025
| Date | Type | Sale Price | Title Company |
|---|---|---|---|
| Deed | $570,000 | Freedom Title | |
| Bargain Sale Deed | $281,500 | The Title Company Of Jersey | |
| Quit Claim Deed | -- | None Available |
| Date | Status | Loan Amount | Loan Type |
|---|---|---|---|
| Open | $532,500 | New Conventional | |
| Previous Owner | $244,633 | FHA |
| Date | Event | Price | List to Sale | Price per Sq Ft |
|---|---|---|---|---|
| 10/24/2025 10/24/25 | Sold | $570,000 | -4.2% | $285 / Sq Ft |
| 09/17/2025 09/17/25 | Pending | -- | -- | -- |
| 08/30/2025 08/30/25 | For Sale | $595,000 | -- | $298 / Sq Ft |
| Year | Tax Paid | Tax Assessment Tax Assessment Total Assessment is a certain percentage of the fair market value that is determined by local assessors to be the total taxable value of land and additions on the property. | Land | Improvement |
|---|---|---|---|---|
| 2025 | $6,277 | $273,500 | $140,300 | $133,200 |
| 2024 | $6,277 | $273,500 | $140,300 | $133,200 |
| 2023 | $5,968 | $273,500 | $140,300 | $133,200 |
| 2022 | $5,749 | $273,500 | $140,300 | $133,200 |
| 2021 | $4,103 | $273,500 | $140,300 | $133,200 |
| 2020 | $5,331 | $273,500 | $140,300 | $133,200 |
| 2019 | $5,188 | $273,500 | $140,300 | $133,200 |
| 2018 | $5,052 | $273,500 | $140,300 | $133,200 |
| 2017 | $4,989 | $273,500 | $140,300 | $133,200 |
| 2016 | $5,073 | $273,500 | $140,300 | $133,200 |
| 2015 | $4,937 | $273,500 | $140,300 | $133,200 |
| 2014 | $4,819 | $327,400 | $183,700 | $143,700 |
Seller's Agent in 2025
Burton Wilkins
GOLDCOAST SOTHEBY'S INTERNATIONAL REALTY
(609) 513-2500
20 in this area
189 Total Sales
Seller Co-Listing Agent in 2025
Emily Wilkins
GOLDCOAST SOTHEBY'S INTERNATIONAL REALTY
(609) 513-2029
8 in this area
71 Total Sales
Buyer's Agent in 2025
Stephen Booth
BERKSHIRE HATHAWAY HS FOX & ROACH oc109
(609) 425-5951
2 in this area
15 Total Sales
Source: Cape May County Association of REALTORS®
MLS Number: 252556
APN: 11-00647-0000-00030
Disclaimer: Certain information contained herein is derived from information provided by parties other than Homes.com. All information provided is deemed reliable, but is not guaranteed to be accurate and should be independently verified.
![]() Broker Reciprocity: The data relating to real estate for sale or rent on this web site comes in part from the Broker Reciprocity program of the Cape May County Multiple Listing Service. Real estate listings held by brokerage firms other than Ten-X are marked with the Broker Reciprocity logo or the Broker Reciprocity thumbnail logo and detailed information about them includes the name of the listing brokers. This information is deemed reliable but not guaranteed. Representations as subject to verification by inspection and subject to change without notice. Some properties which appear for sale or rent on this website may no longer be available because they are under contract, have sold, or are no longer being offered for sale or rent. Information is deemed to be accurate but not guaranteed.
Broker Reciprocity: The data relating to real estate for sale or rent on this web site comes in part from the Broker Reciprocity program of the Cape May County Multiple Listing Service. Real estate listings held by brokerage firms other than Ten-X are marked with the Broker Reciprocity logo or the Broker Reciprocity thumbnail logo and detailed information about them includes the name of the listing brokers. This information is deemed reliable but not guaranteed. Representations as subject to verification by inspection and subject to change without notice. Some properties which appear for sale or rent on this website may no longer be available because they are under contract, have sold, or are no longer being offered for sale or rent. Information is deemed to be accurate but not guaranteed.