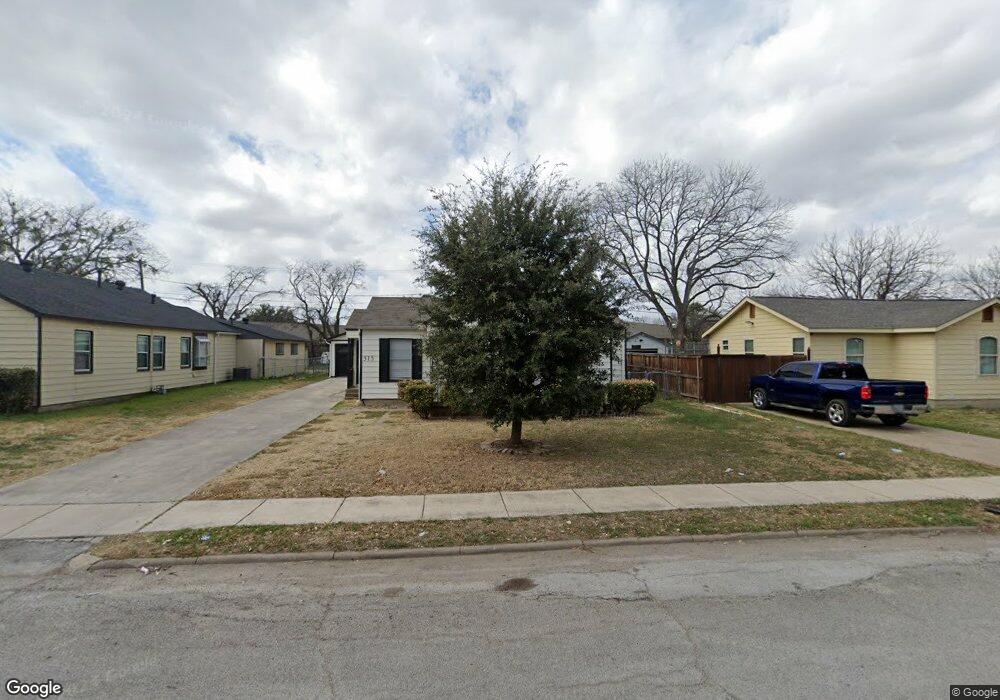
315 NE 10th St Grand Prairie, TX 75050
Estimated Value: $238,000 - $260,434
2
Beds
1
Bath
1,192
Sq Ft
$210/Sq Ft
Est. Value
About This Home
This home is located at 315 NE 10th St, Grand Prairie, TX 75050 and is currently estimated at $249,859, approximately $209 per square foot. 315 NE 10th St is a home located in Dallas County with nearby schools including Crosswinds High School, James Fannin Middle, and Grand Prairie High School.
Ownership History
Date
Name
Owned For
Owner Type
Purchase Details
Closed on
Sep 30, 2016
Sold by
Delhern Invesments Llc
Bought by
Ovalle Lesly and Martinez Emmanuel Pineda
Current Estimated Value
Home Financials for this Owner
Home Financials are based on the most recent Mortgage that was taken out on this home.
Original Mortgage
$97,680
Outstanding Balance
$78,084
Interest Rate
3.37%
Mortgage Type
FHA
Estimated Equity
$171,775
Purchase Details
Closed on
May 6, 2016
Sold by
Mills Dorothy E
Bought by
Delhern Investment Llc
Create a Home Valuation Report for This Property
The Home Valuation Report is an in-depth analysis detailing your home's value as well as a comparison with similar homes in the area
Home Values in the Area
Average Home Value in this Area
Purchase History
| Date | Buyer | Sale Price | Title Company |
|---|---|---|---|
| Ovalle Lesly | -- | None Available | |
| Delhern Investment Llc | -- | Attorney |
Source: Public Records
Mortgage History
| Date | Status | Borrower | Loan Amount |
|---|---|---|---|
| Open | Ovalle Lesly | $97,680 |
Source: Public Records
Tax History Compared to Growth
Tax History
| Year | Tax Paid | Tax Assessment Tax Assessment Total Assessment is a certain percentage of the fair market value that is determined by local assessors to be the total taxable value of land and additions on the property. | Land | Improvement |
|---|---|---|---|---|
| 2025 | $2,769 | $262,820 | $45,000 | $217,820 |
| 2024 | $2,769 | $251,620 | $45,000 | $206,620 |
| 2023 | $2,769 | $255,540 | $40,000 | $215,540 |
| 2022 | $4,592 | $181,010 | $40,000 | $141,010 |
| 2021 | $3,847 | $144,740 | $25,000 | $119,740 |
| 2020 | $3,900 | $138,320 | $25,000 | $113,320 |
| 2019 | $3,317 | $113,540 | $20,000 | $93,540 |
| 2018 | $3,077 | $105,330 | $15,000 | $90,330 |
| 2017 | $2,473 | $105,330 | $15,000 | $90,330 |
| 2016 | $1,871 | $64,080 | $12,000 | $52,080 |
| 2015 | $44 | $57,550 | $10,000 | $47,550 |
| 2014 | $44 | $56,640 | $10,000 | $46,640 |
Source: Public Records
Map
Nearby Homes