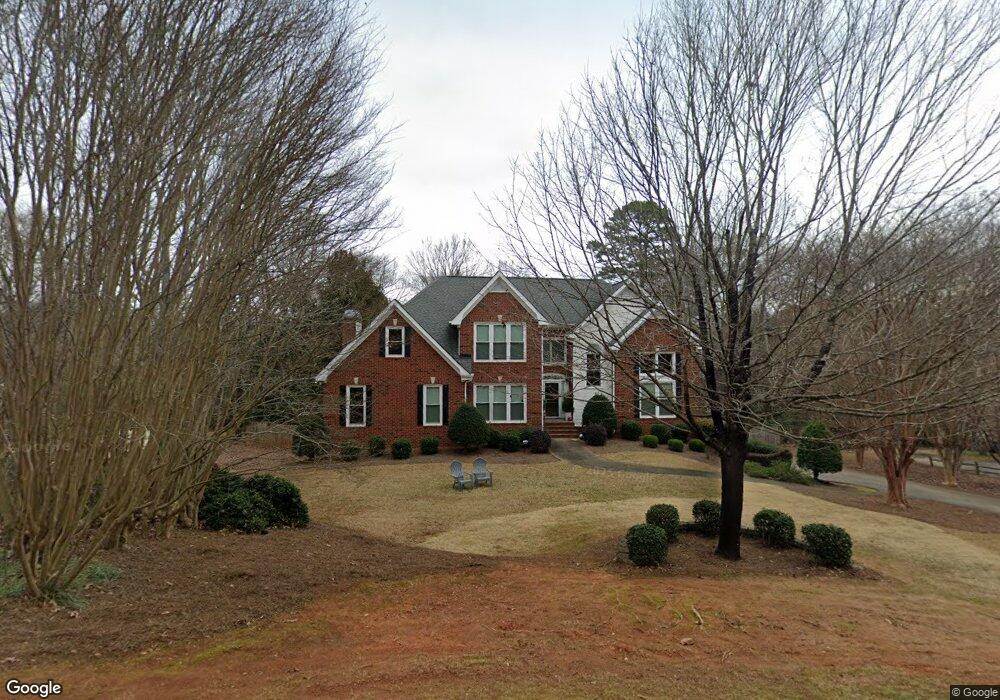
315 Oakbend Dr Athens, GA 30606
Oak Bend NeighborhoodEstimated Value: $636,523 - $734,000
5
Beds
4
Baths
4,927
Sq Ft
$137/Sq Ft
Est. Value
About This Home
This home is located at 315 Oakbend Dr, Athens, GA 30606 and is currently estimated at $673,631, approximately $136 per square foot. 315 Oakbend Dr is a home located in Clarke County with nearby schools including Timothy Elementary School, Clarke Middle School, and Clarke Central High School.
Ownership History
Date
Name
Owned For
Owner Type
Purchase Details
Closed on
May 25, 2011
Sold by
Federal National Mortgage Association
Bought by
Shaw Larry J
Current Estimated Value
Home Financials for this Owner
Home Financials are based on the most recent Mortgage that was taken out on this home.
Original Mortgage
$225,482
Outstanding Balance
$155,198
Interest Rate
4.75%
Mortgage Type
FHA
Estimated Equity
$518,433
Purchase Details
Closed on
Feb 1, 2011
Sold by
Buntin Charles K and Buntin Patricia D
Bought by
Bac Home Loans Servicing Lp Fka Country
Purchase Details
Closed on
Feb 24, 1995
Sold by
Kemp Brian P and Kemp Martha A
Bought by
Buntin Charles K and Bunti Patricia D
Purchase Details
Closed on
Nov 16, 1993
Sold by
Kemp Brian P
Bought by
Kemp Development & Construction Co
Purchase Details
Closed on
Sep 24, 1993
Sold by
Barrett John H
Bought by
Kemp Brian P
Create a Home Valuation Report for This Property
The Home Valuation Report is an in-depth analysis detailing your home's value as well as a comparison with similar homes in the area
Home Values in the Area
Average Home Value in this Area
Purchase History
| Date | Buyer | Sale Price | Title Company |
|---|---|---|---|
| Shaw Larry J | $235,000 | -- | |
| Bac Home Loans Servicing Lp Fka Country | $405,700 | -- | |
| Buntin Charles K | $208,000 | -- | |
| Kemp Brian P | -- | -- | |
| Kemp Development & Construction Co | -- | -- | |
| Kemp Brian P | $20,000 | -- |
Source: Public Records
Mortgage History
| Date | Status | Borrower | Loan Amount |
|---|---|---|---|
| Open | Shaw Larry J | $225,482 |
Source: Public Records
Tax History Compared to Growth
Tax History
| Year | Tax Paid | Tax Assessment Tax Assessment Total Assessment is a certain percentage of the fair market value that is determined by local assessors to be the total taxable value of land and additions on the property. | Land | Improvement |
|---|---|---|---|---|
| 2025 | $4,354 | $216,779 | $20,000 | $196,779 |
| 2024 | $4,354 | $213,768 | $20,000 | $193,768 |
| 2023 | $4,392 | $206,457 | $20,000 | $186,457 |
| 2022 | $4,182 | $173,381 | $20,000 | $153,381 |
| 2021 | $3,969 | $141,173 | $20,000 | $121,173 |
| 2020 | $3,925 | $137,932 | $20,000 | $117,932 |
| 2019 | $3,844 | $129,826 | $20,000 | $109,826 |
| 2018 | $3,862 | $131,111 | $20,000 | $111,111 |
| 2017 | $3,790 | $125,947 | $20,000 | $105,947 |
| 2016 | $3,707 | $120,031 | $20,000 | $100,031 |
| 2015 | $4,033 | $118,608 | $20,000 | $98,608 |
| 2014 | $4,052 | $118,989 | $20,000 | $98,989 |
Source: Public Records
Map
Nearby Homes
- 114 Telfair Place
- 158 Mallard Pointe Way
- 461 Oglethorpe Ave
- 1845 Olympus Ct
- 1847 Olympus Ct
- 1842 Olympus Ct
- 245 Mallard Pointe Way
- 125 Wood Lake Dr Unit 210
- 1771 Timothy Rd
- 292 Wood Lake Dr
- 190 Kirkwood Dr
- 101 Wood Lake Dr Unit 307
- 136 Timothy Park Ln
- 137 Timothy Park Ln
- 320 Wilde Oak Place
- 232 Epps Bridge Rd Unit 1A
- 140 Cypress Manor Ln
- 325 Oakbend Dr
- 305 Oakbend Dr
- 305 Crystal Ct
- 119 Crystal Ct
- 117 Telfair Place
- 315 Crystal Ct
- 295 Oakbend Dr
- 335 Oakbend Dr
- 115 Telfair Place
- 325 Crystal Ct
- 121 Telfair Place Unit 39
- 121 Telfair Place
- 208 Mchenry Dr
- 244 Mchenry Dr
- 0 Crystal Ct
- 205 Waterford Way
- 113 Telfair Place
- 248 Mchenry Dr
- 345 Oakbend Dr
- 240 Mchenry Dr