Estimated Value: $535,000 - $681,000
6
Beds
3
Baths
4,554
Sq Ft
$136/Sq Ft
Est. Value
About This Home
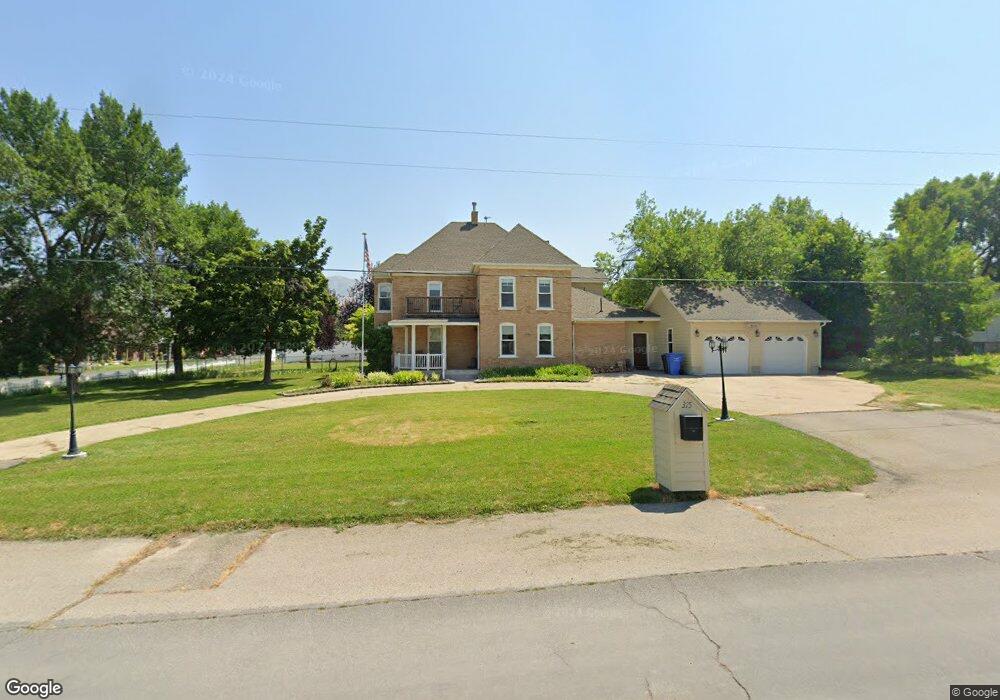
This home is located at 315 S 100 W, Hyrum, UT 84319 and is currently estimated at $619,991, approximately $136 per square foot. 315 S 100 W is a home located in Cache County with nearby schools including Lincoln School, South Cache Middle School, and Mountain Crest High School.
Ownership History
Date
Name
Owned For
Owner Type
Purchase Details
Closed on
Mar 26, 2019
Sold by
Roche Curtis G and Roche Curtis
Bought by
The Curtis G Roche Trust
Current Estimated Value
Purchase Details
Closed on
Oct 10, 2017
Sold by
Rocbe Curtis G
Bought by
Roche Curtis
Home Financials for this Owner
Home Financials are based on the most recent Mortgage that was taken out on this home.
Original Mortgage
$145,388
Outstanding Balance
$121,147
Interest Rate
3.82%
Mortgage Type
New Conventional
Estimated Equity
$498,844
Purchase Details
Closed on
May 17, 2010
Sold by
Homesales Inc
Bought by
Roche Curtis G
Purchase Details
Closed on
May 27, 2008
Sold by
Jensen Laurel H and Jensen Gayle
Bought by
Homesales Inc
Create a Home Valuation Report for This Property
The Home Valuation Report is an in-depth analysis detailing your home's value as well as a comparison with similar homes in the area
Home Values in the Area
Average Home Value in this Area
Purchase History
| Date | Buyer | Sale Price | Title Company |
|---|---|---|---|
| The Curtis G Roche Trust | -- | None Available | |
| Roche Curtis | -- | -- | |
| Roche Curtis G | -- | Accommodation | |
| Homesales Inc | $215,600 | Backman Title Services |
Source: Public Records
Mortgage History
| Date | Status | Borrower | Loan Amount |
|---|---|---|---|
| Open | Roche Curtis | $145,388 |
Source: Public Records
Tax History Compared to Growth
Tax History
| Year | Tax Paid | Tax Assessment Tax Assessment Total Assessment is a certain percentage of the fair market value that is determined by local assessors to be the total taxable value of land and additions on the property. | Land | Improvement |
|---|---|---|---|---|
| 2025 | $2,267 | $325,455 | $0 | $0 |
| 2024 | $2,442 | $327,375 | $0 | $0 |
| 2023 | $2,244 | $287,640 | $0 | $0 |
| 2022 | $2,563 | $314,835 | $0 | $0 |
| 2021 | $233 | $421,119 | $69,420 | $351,699 |
| 2020 | $2,064 | $345,822 | $69,420 | $276,402 |
| 2019 | $2,076 | $326,002 | $49,600 | $276,402 |
| 2018 | $1,955 | $296,800 | $49,600 | $247,200 |
| 2017 | $1,977 | $165,730 | $0 | $0 |
| 2016 | $2,022 | $165,730 | $0 | $0 |
| 2015 | $1,685 | $137,735 | $0 | $0 |
| 2014 | $1,652 | $138,115 | $0 | $0 |
| 2013 | -- | $138,115 | $0 | $0 |
Source: Public Records
Map
Nearby Homes