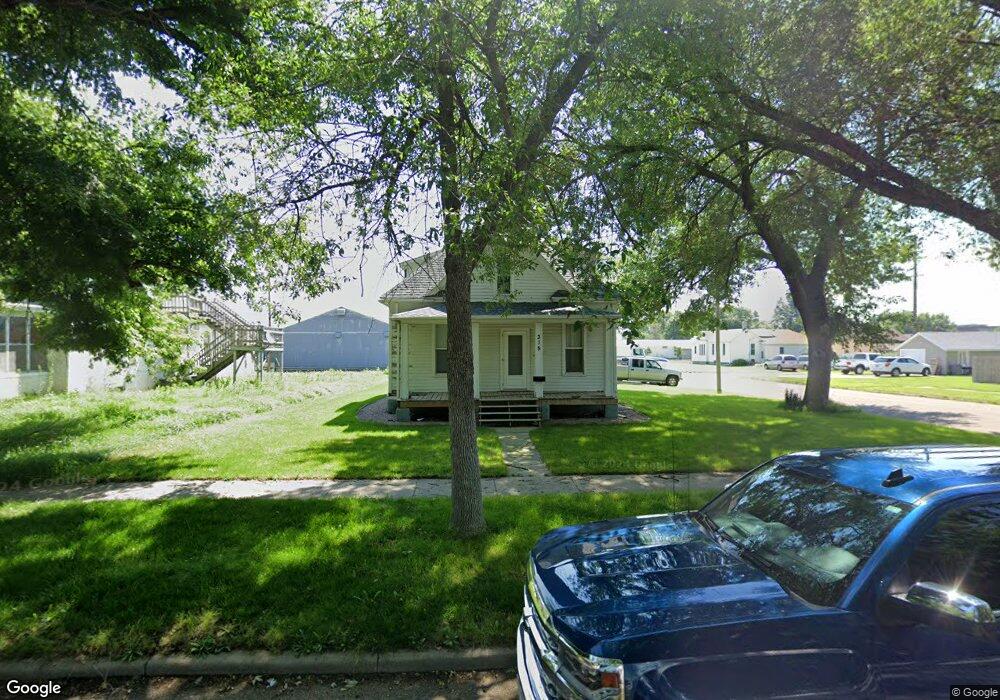
315 S 8th St Norfolk, NE 68701
Estimated Value: $187,000 - $216,000
3
Beds
2
Baths
1,639
Sq Ft
$125/Sq Ft
Est. Value
About This Home
This home is located at 315 S 8th St, Norfolk, NE 68701 and is currently estimated at $204,694, approximately $124 per square foot. 315 S 8th St is a home located in Madison County with nearby schools including Norfolk Senior High School, Keystone Christian Academy, and Christ Lutheran School.
Ownership History
Date
Name
Owned For
Owner Type
Purchase Details
Closed on
Aug 8, 2008
Sold by
Elkhorn Valley Community Dev Corp
Bought by
Allemang Philip E
Current Estimated Value
Home Financials for this Owner
Home Financials are based on the most recent Mortgage that was taken out on this home.
Original Mortgage
$70,000
Interest Rate
6.42%
Mortgage Type
New Conventional
Purchase Details
Closed on
Jul 7, 2008
Sold by
James Kenneth M
Bought by
Elkhorn Valley Community Dev~Corp
Home Financials for this Owner
Home Financials are based on the most recent Mortgage that was taken out on this home.
Original Mortgage
$70,000
Interest Rate
6.42%
Mortgage Type
New Conventional
Purchase Details
Closed on
Oct 31, 2001
Sold by
Gehring Royce G and Gehring Marilyn A
Bought by
James Kenneth M
Create a Home Valuation Report for This Property
The Home Valuation Report is an in-depth analysis detailing your home's value as well as a comparison with similar homes in the area
Home Values in the Area
Average Home Value in this Area
Purchase History
| Date | Buyer | Sale Price | Title Company |
|---|---|---|---|
| Allemang Philip E | $86,600 | -- | |
| Elkhorn Valley Community Dev~Corp | $81,600 | -- | |
| James Kenneth M | $70,000 | -- |
Source: Public Records
Mortgage History
| Date | Status | Borrower | Loan Amount |
|---|---|---|---|
| Closed | Allemang Philip E | $70,000 | |
| Closed | Allemang Philip E | $15,000 |
Source: Public Records
Tax History Compared to Growth
Tax History
| Year | Tax Paid | Tax Assessment Tax Assessment Total Assessment is a certain percentage of the fair market value that is determined by local assessors to be the total taxable value of land and additions on the property. | Land | Improvement |
|---|---|---|---|---|
| 2024 | $2,311 | $186,066 | $7,343 | $178,723 |
| 2023 | $3,167 | $171,309 | $7,343 | $163,966 |
| 2022 | $2,850 | $153,741 | $7,343 | $146,398 |
| 2021 | $2,621 | $141,653 | $7,343 | $134,310 |
| 2020 | $2,408 | $130,563 | $7,343 | $123,220 |
| 2019 | $2,299 | $120,389 | $7,343 | $113,046 |
| 2018 | $2,006 | $106,808 | $5,874 | $100,934 |
| 2017 | $1,805 | $95,994 | $5,874 | $90,120 |
| 2016 | $1,675 | $88,883 | $5,439 | $83,444 |
| 2015 | $1,675 | $88,883 | $5,439 | $83,444 |
| 2014 | $1,648 | $84,909 | $5,439 | $79,470 |
| 2013 | $1,597 | $79,710 | $5,439 | $74,271 |
Source: Public Records
Map
Nearby Homes
- 602 S 10th St
- 705 S 10th St
- 404 S 12th St
- 603 S 4th St
- 1208 W Phillip Ave
- 805 S 5th St
- 1204 W Madison Ave
- 1217 Hayes Ave
- 1200 Prime Stop Way
- 3302 Stonebrooke Ln
- 1103 Koenigstein Ave
- 706 Columbia St
- 906 S 4th St
- 918 S 5th St
- 700 S 2nd St
- 410 W Michigan Ave
- 1312 Hayes Ave
- 1313 W Park Ave
- 1007 W Prospect Ave
- 103 S 13th Place