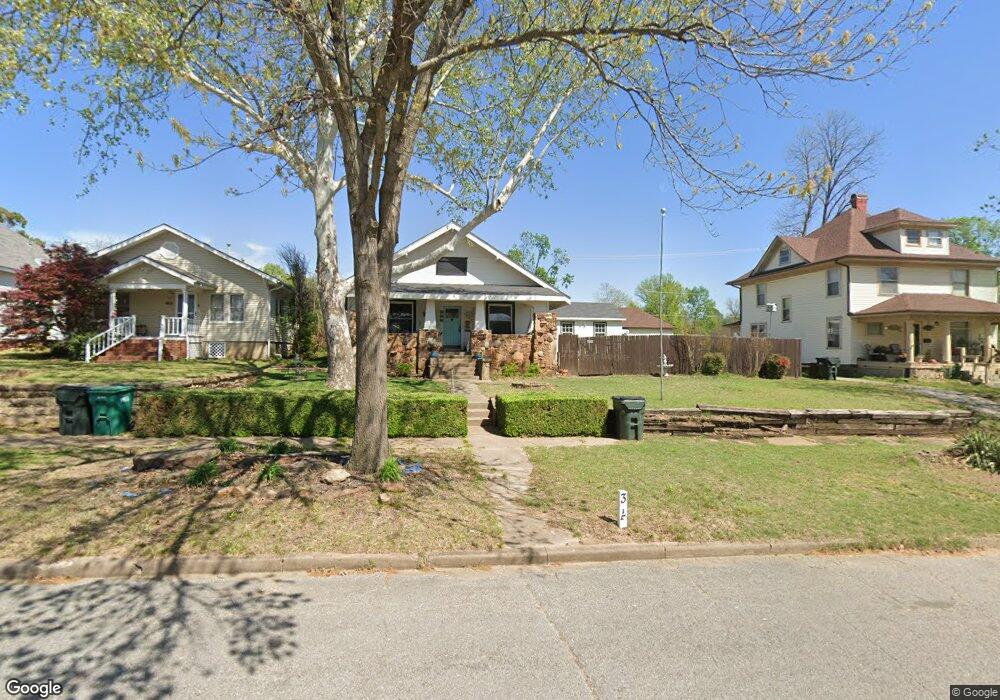
315 S Elm St Sapulpa, OK 74066
Estimated Value: $218,696 - $231,000
3
Beds
2
Baths
2,157
Sq Ft
$103/Sq Ft
Est. Value
About This Home
This home is located at 315 S Elm St, Sapulpa, OK 74066 and is currently estimated at $222,674, approximately $103 per square foot. 315 S Elm St is a home located in Creek County with nearby schools including Sapulpa Junior High School, Sapulpa Middle School, and Sapulpa High School.
Ownership History
Date
Name
Owned For
Owner Type
Purchase Details
Closed on
Jun 25, 2008
Sold by
Baldwin Susan D
Bought by
Baldwin Jeffrey G
Current Estimated Value
Home Financials for this Owner
Home Financials are based on the most recent Mortgage that was taken out on this home.
Original Mortgage
$102,000
Outstanding Balance
$65,252
Interest Rate
5.99%
Mortgage Type
New Conventional
Estimated Equity
$157,422
Purchase Details
Closed on
Jun 17, 2008
Sold by
Baldwin Susan D
Bought by
Baldwin Jeffrey D
Home Financials for this Owner
Home Financials are based on the most recent Mortgage that was taken out on this home.
Original Mortgage
$102,000
Outstanding Balance
$65,252
Interest Rate
5.99%
Mortgage Type
New Conventional
Estimated Equity
$157,422
Purchase Details
Closed on
Aug 24, 2007
Sold by
Mcalister Bryan T and Mcalister Byran Thoedore
Bought by
Baldwin Jeffrey G and Baldwin Susan D
Home Financials for this Owner
Home Financials are based on the most recent Mortgage that was taken out on this home.
Original Mortgage
$90,000
Interest Rate
6.72%
Mortgage Type
New Conventional
Create a Home Valuation Report for This Property
The Home Valuation Report is an in-depth analysis detailing your home's value as well as a comparison with similar homes in the area
Home Values in the Area
Average Home Value in this Area
Purchase History
| Date | Buyer | Sale Price | Title Company |
|---|---|---|---|
| Baldwin Jeffrey G | -- | Buiders Title And Escrow Llc | |
| Baldwin Jeffrey D | -- | None Available | |
| Baldwin Jeffrey G | $120,000 | None Available |
Source: Public Records
Mortgage History
| Date | Status | Borrower | Loan Amount |
|---|---|---|---|
| Open | Baldwin Jeffrey G | $102,000 | |
| Previous Owner | Baldwin Jeffrey G | $90,000 |
Source: Public Records
Tax History Compared to Growth
Tax History
| Year | Tax Paid | Tax Assessment Tax Assessment Total Assessment is a certain percentage of the fair market value that is determined by local assessors to be the total taxable value of land and additions on the property. | Land | Improvement |
|---|---|---|---|---|
| 2025 | $1,752 | $15,583 | $2,436 | $13,147 |
| 2024 | $1,752 | $15,409 | $2,436 | $12,973 |
| 2023 | $1,752 | $14,960 | $2,436 | $12,524 |
| 2022 | $1,554 | $14,524 | $2,436 | $12,088 |
| 2021 | $1,673 | $15,101 | $2,436 | $12,665 |
| 2020 | $1,612 | $14,661 | $2,436 | $12,225 |
| 2019 | $1,671 | $15,097 | $2,436 | $12,661 |
| 2018 | $1,653 | $14,658 | $2,436 | $12,222 |
| 2017 | $1,644 | $14,658 | $2,436 | $12,222 |
| 2016 | $1,563 | $14,658 | $2,436 | $12,222 |
| 2015 | -- | $14,658 | $2,436 | $12,222 |
| 2014 | -- | $14,394 | $1,801 | $12,593 |
Source: Public Records
Map
Nearby Homes
- 320 E Mckinley Ave
- 507 S Park St
- 415 S Walnut St
- 210 S Water St
- 612 S Park St
- 511 S Maple St
- 317 S Poplar St
- 706 E Thompson Ave
- 111 S Poplar St
- 314 S Poplar St
- 410 S Poplar St
- 609 S Poplar St
- 702 S Main St
- 206 S Mounds St
- 724 S Main St
- 303 W Mckinley Ave
- 637 S Mounds St
- 14 S Mounds St
- 706 S Poplar St
- 310 W Lee Ave