
Seller's Agent in 2025
Randal Longo
iSave Realty
(866) 515-5099
2 in this area
1,364 Total Sales
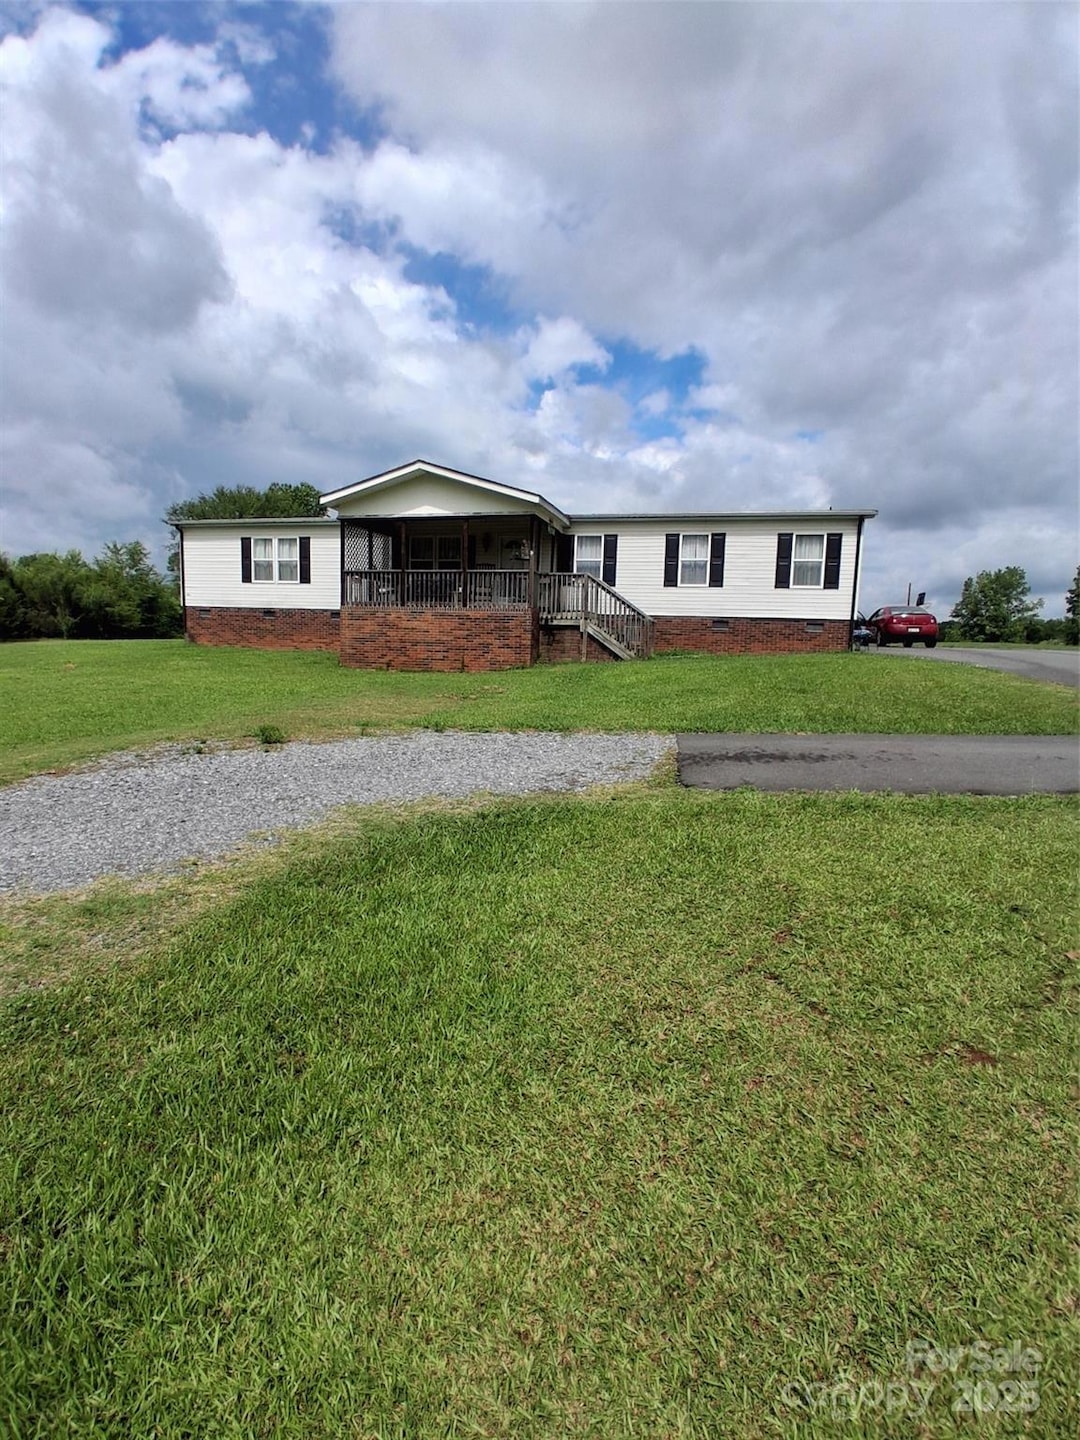
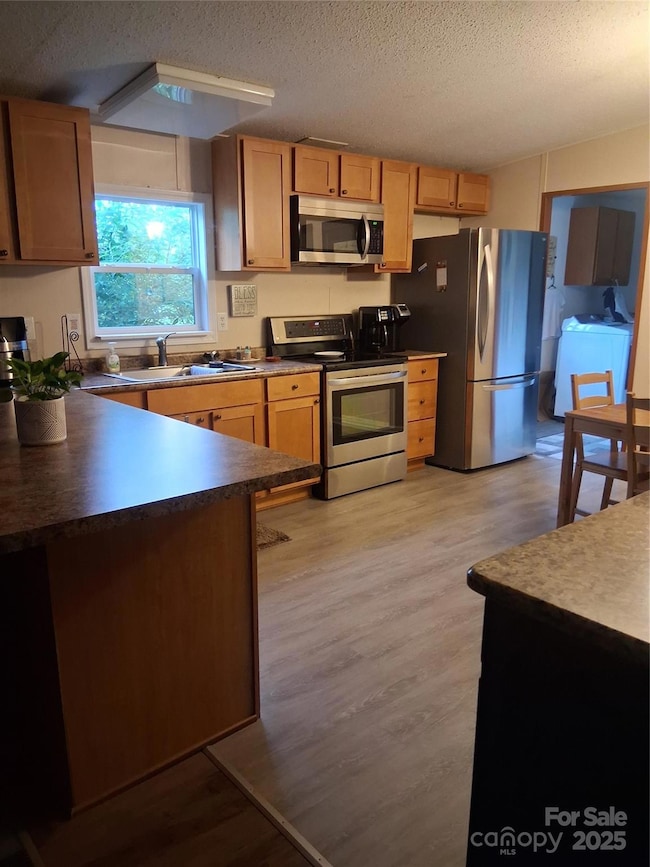
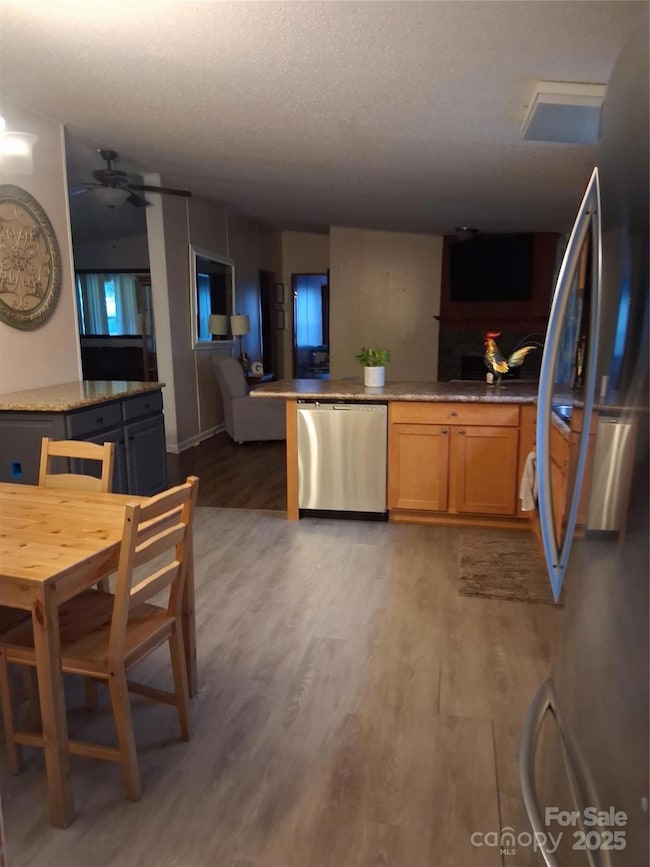
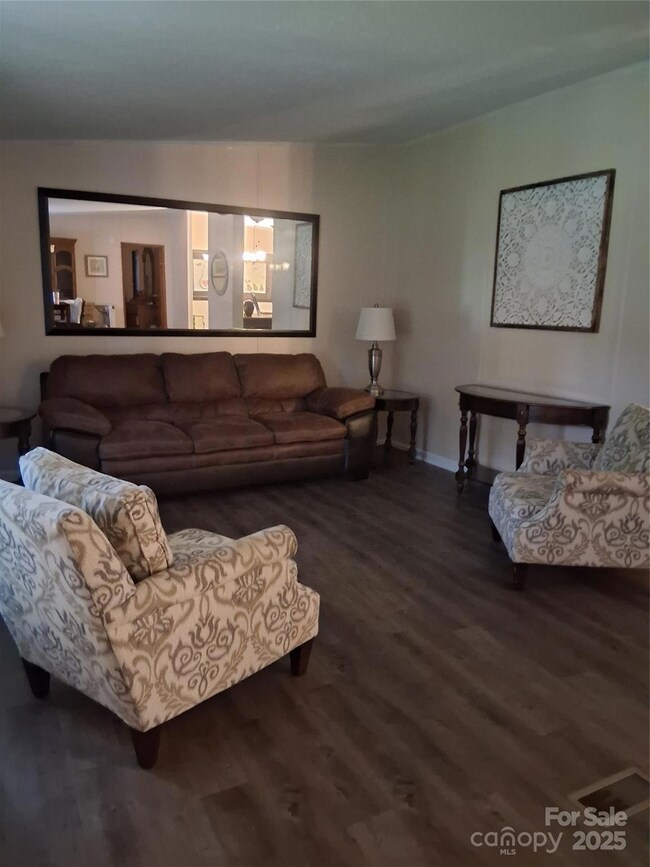
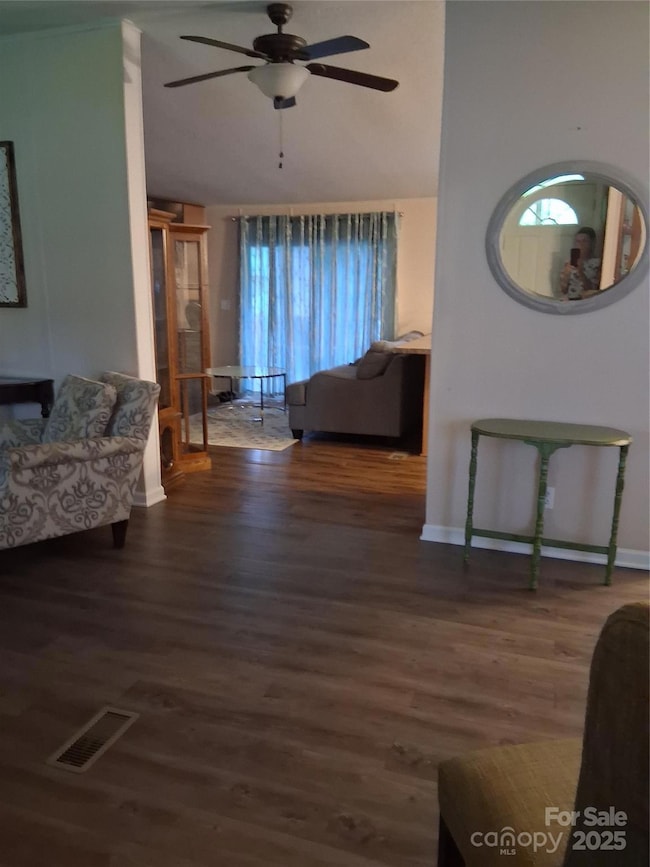
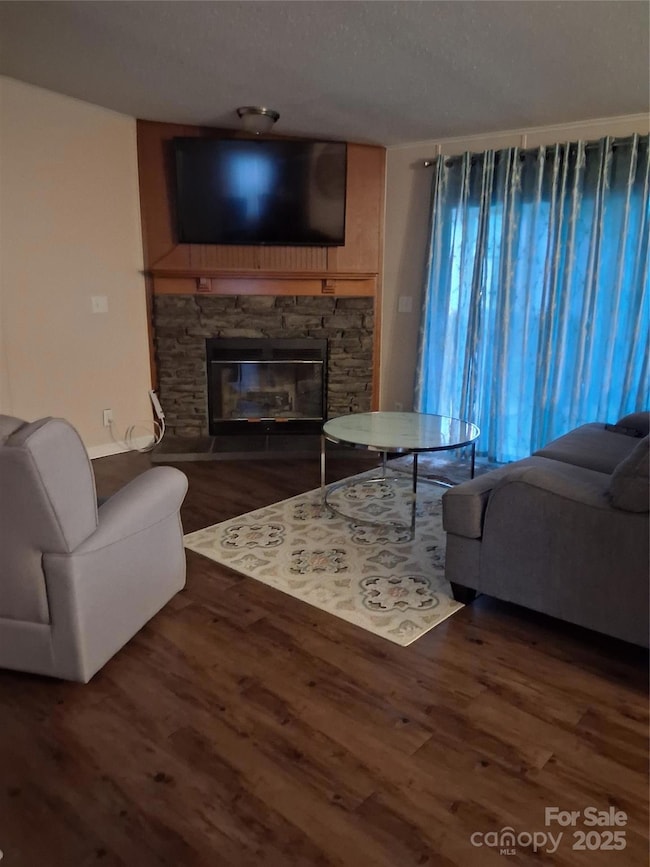
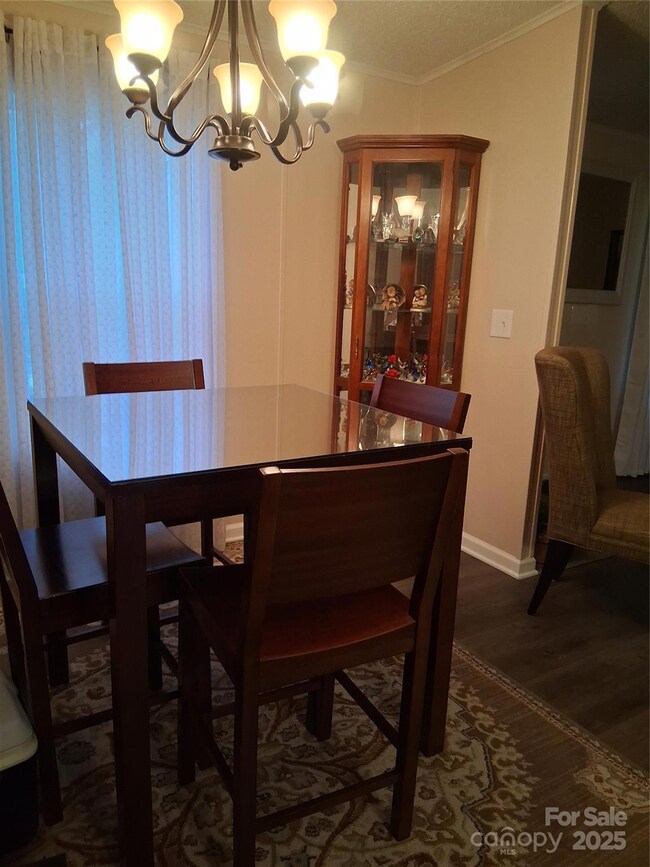
Home was totally renovated in 2017New cabinets ,countertops in the kitchen. New appliances, bathrooms New tubs, toilet ,vanities. New flooring. 2023 New insulated Windows & doors. New well pump.
Last Agent to Sell the Property
iSave Realty Brokerage Email: info@ISaveRealty.com License #75999 Listed on: 06/02/2025
| Date | Type | Sale Price | Title Company |
|---|---|---|---|
| Deed | $215,000 | None Listed On Document | |
| Deed Of Distribution | -- | None Listed On Document | |
| Deed Of Distribution | -- | None Listed On Document | |
| Deed | $50,000 | None Available | |
| Deed Of Distribution | -- | -- | |
| Deed | $72,500 | -- | |
| Limited Warranty Deed | $34,000 | -- | |
| Sheriffs Deed | $98,790 | -- |
| Date | Status | Loan Amount | Loan Type |
|---|---|---|---|
| Previous Owner | $47,500 | New Conventional |
| Date | Event | Price | List to Sale | Price per Sq Ft |
|---|---|---|---|---|
| 08/05/2025 08/05/25 | Sold | $215,000 | -5.3% | $137 / Sq Ft |
| 06/26/2025 06/26/25 | Price Changed | $227,000 | -18.9% | $145 / Sq Ft |
| 06/02/2025 06/02/25 | For Sale | $280,000 | -- | $179 / Sq Ft |
| Year | Tax Paid | Tax Assessment Tax Assessment Total Assessment is a certain percentage of the fair market value that is determined by local assessors to be the total taxable value of land and additions on the property. | Land | Improvement |
|---|---|---|---|---|
| 2025 | $322 | $2,566 | $469 | $2,097 |
| 2024 | $1,302 | $3,347 | $2,174 | $1,173 |
| 2023 | $1,264 | $3,347 | $2,174 | $1,173 |
| 2022 | $1,130 | $3,347 | $2,174 | $1,173 |
| 2021 | -- | $3,347 | $2,174 | $1,173 |
| 2020 | $1,104 | $3,347 | $0 | $0 |
| 2019 | $1,012 | $2,910 | $0 | $0 |
| 2018 | $1,001 | $2,910 | $0 | $0 |
| 2017 | $1,047 | $3,180 | $0 | $0 |
| 2016 | $1,021 | $3,180 | $0 | $0 |
| 2014 | $1,004 | $3,180 | $1,680 | $1,500 |
| 2013 | $1,004 | $3,360 | $1,680 | $1,680 |
Seller's Agent in 2025
Randal Longo
iSave Realty
(866) 515-5099
2 in this area
1,364 Total Sales
Buyer's Agent in 2025
Nathan Moss
Dickson & Associates Realtors
(803) 627-3174
33 in this area
126 Total Sales
Source: Canopy MLS (Canopy Realtor® Association)
MLS Number: 4266327
APN: 2670000035
Disclaimer: Certain information contained herein is derived from information provided by parties other than Homes.com. All information provided is deemed reliable, but is not guaranteed to be accurate and should be independently verified.
![]() All data is obtained from various sources and may not have been verified by broker or MLS GRID. Supplied Open House Information is subject to change without notice. All information should be independently reviewed and verified for accuracy. Properties may or may not be listed by the office/agent presenting the information. Some IDX listings have been excluded from this website.
All data is obtained from various sources and may not have been verified by broker or MLS GRID. Supplied Open House Information is subject to change without notice. All information should be independently reviewed and verified for accuracy. Properties may or may not be listed by the office/agent presenting the information. Some IDX listings have been excluded from this website.
Based on information submitted to the MLS GRID
Ask me questions while you tour the home.