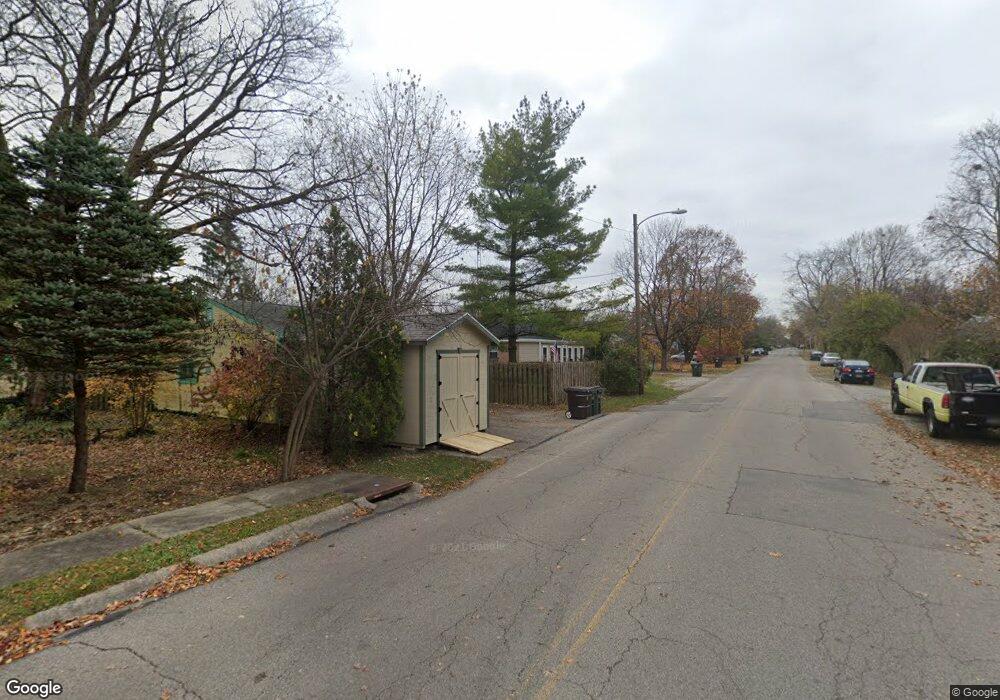
315 S High St Yellow Springs, OH 45387
Estimated Value: $246,000 - $292,000
3
Beds
2
Baths
1,110
Sq Ft
$240/Sq Ft
Est. Value
About This Home
This home is located at 315 S High St, Yellow Springs, OH 45387 and is currently estimated at $266,908, approximately $240 per square foot. 315 S High St is a home located in Greene County with nearby schools including Mills Lawn Elementary School, Yellow Springs High School & McKinney Middle School, and The Antioch School.
Ownership History
Date
Name
Owned For
Owner Type
Purchase Details
Closed on
Jan 31, 2017
Sold by
Hubbuch Behrle W and Hubbuch Valerie Jeannette
Bought by
Scheibert Robert M
Current Estimated Value
Home Financials for this Owner
Home Financials are based on the most recent Mortgage that was taken out on this home.
Original Mortgage
$80,000
Outstanding Balance
$66,237
Interest Rate
4.2%
Mortgage Type
New Conventional
Estimated Equity
$200,671
Purchase Details
Closed on
Jan 4, 2001
Sold by
Mcdaniel Tilton N and Elcess Frank
Bought by
Hubbuch Behrle W
Home Financials for this Owner
Home Financials are based on the most recent Mortgage that was taken out on this home.
Original Mortgage
$91,200
Interest Rate
10%
Purchase Details
Closed on
Dec 20, 2000
Sold by
Estate Of Josephine Ann Mcdaniel
Bought by
Mcdaniel Tilton N
Home Financials for this Owner
Home Financials are based on the most recent Mortgage that was taken out on this home.
Original Mortgage
$91,200
Interest Rate
10%
Create a Home Valuation Report for This Property
The Home Valuation Report is an in-depth analysis detailing your home's value as well as a comparison with similar homes in the area
Home Values in the Area
Average Home Value in this Area
Purchase History
| Date | Buyer | Sale Price | Title Company |
|---|---|---|---|
| Scheibert Robert M | $130,000 | None Available | |
| Hubbuch Behrle W | $114,000 | -- | |
| Mcdaniel Tilton N | -- | -- |
Source: Public Records
Mortgage History
| Date | Status | Borrower | Loan Amount |
|---|---|---|---|
| Open | Scheibert Robert M | $80,000 | |
| Previous Owner | Hubbuch Behrle W | $91,200 | |
| Closed | Hubbuch Behrle W | $22,800 |
Source: Public Records
Tax History Compared to Growth
Tax History
| Year | Tax Paid | Tax Assessment Tax Assessment Total Assessment is a certain percentage of the fair market value that is determined by local assessors to be the total taxable value of land and additions on the property. | Land | Improvement |
|---|---|---|---|---|
| 2024 | $4,208 | $73,910 | $23,050 | $50,860 |
| 2023 | $4,208 | $73,910 | $23,050 | $50,860 |
| 2022 | $3,499 | $58,200 | $20,170 | $38,030 |
| 2021 | $3,370 | $58,200 | $20,170 | $38,030 |
| 2020 | $3,382 | $58,200 | $20,170 | $38,030 |
| 2019 | $3,056 | $47,870 | $16,330 | $31,540 |
| 2018 | $3,047 | $47,870 | $16,330 | $31,540 |
| 2017 | $2,931 | $47,870 | $16,330 | $31,540 |
| 2016 | $2,687 | $43,950 | $16,330 | $27,620 |
| 2015 | $2,731 | $43,950 | $16,330 | $27,620 |
| 2014 | $4,084 | $43,950 | $16,330 | $27,620 |
Source: Public Records
Map
Nearby Homes
- 414 S High St
- 513 Lincoln Ct
- 504 Phillips St
- 260 King St
- 125 Park Meadows Dr
- Fairfax Plan at Spring Meadows - Maple Street Collection
- Jensen Plan at Spring Meadows - Maple Street Collection
- Denali Plan at Spring Meadows - Maple Street Collection
- Wesley Plan at Spring Meadows - Maple Street Collection
- Greenbriar Plan at Spring Meadows - Maple Street Collection
- Breckenridge Plan at Spring Meadows - Maple Street Collection
- Cumberland Plan at Spring Meadows - Maple Street Collection
- Yosemite Plan at Spring Meadows - Maple Street Collection
- DaVinci Plan at Spring Meadows - Maple Street Collection
- Beacon Plan at Spring Meadows - Maple Street Collection
- Danville Plan at Spring Meadows - Maple Street Collection
- 117 E North College St
- 675 Wright St
- 425 Snowdrop Dr
- 404 Snowdrop Dr
- 317 S High St
- 421 Dayton St
- 319 S High St
- 501 Dayton St
- 415 Dayton St
- 314 S Stafford St
- 321 S High St
- 312 S Stafford St
- 312 S Stafford St
- 316 S Stafford St
- 310 S High St
- 318 S Stafford St
- 503 Dayton St
- 323 S High St
- 320 S Stafford St Unit 322 1/2
- 320 S Stafford St Unit 322
- 316 S High St
- 409 Dayton St
- 511 Dayton St
- 324 S Stafford St