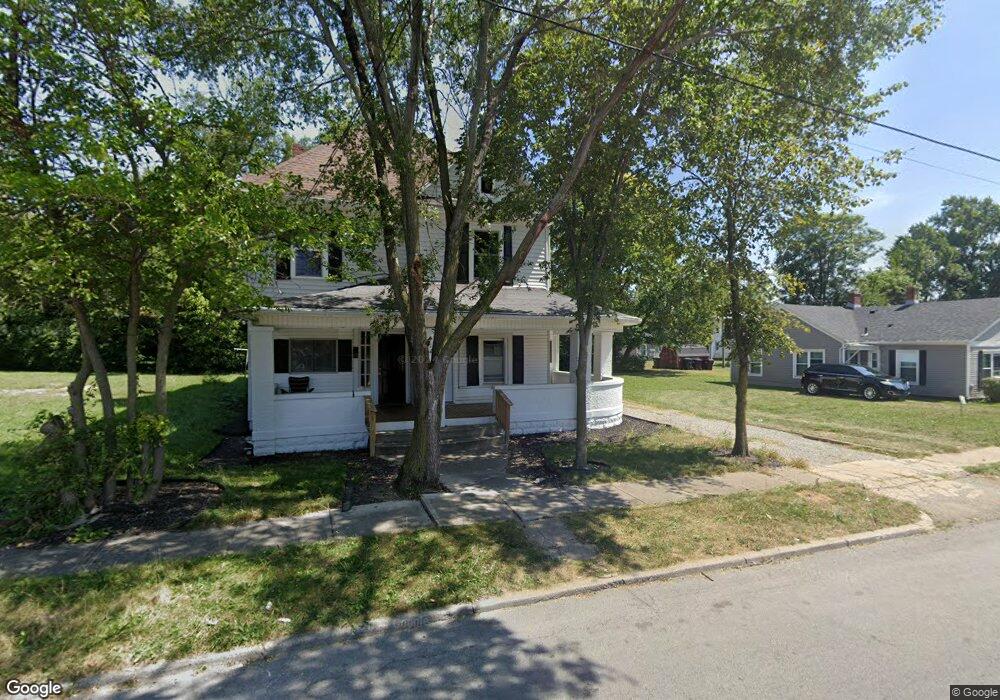
315 S McDonel St Lima, OH 45801
Riverside North NeighborhoodEstimated Value: $76,338 - $157,000
4
Beds
2
Baths
2,976
Sq Ft
$40/Sq Ft
Est. Value
About This Home
This home is located at 315 S McDonel St, Lima, OH 45801 and is currently estimated at $118,085, approximately $39 per square foot. 315 S McDonel St is a home located in Allen County with nearby schools including Heritage Elementary School, Lima North Middle School, and Lima West Middle School.
Ownership History
Date
Name
Owned For
Owner Type
Purchase Details
Closed on
Aug 31, 2023
Sold by
Forcefield Construction Llc
Bought by
Haithcock Gordon E
Current Estimated Value
Purchase Details
Closed on
Apr 9, 2020
Sold by
Ja Stinsx Llc
Bought by
Forcefield Construction Llc
Purchase Details
Closed on
Sep 20, 2019
Sold by
Watkins Kaylean
Bought by
Ja Stinsx Llc
Purchase Details
Closed on
Apr 22, 2019
Sold by
Daniel Bobby K
Bought by
Watkins Kaylean
Purchase Details
Closed on
Apr 12, 2017
Sold by
Springs Day
Bought by
Daniel Bobby K
Purchase Details
Closed on
Mar 10, 2009
Sold by
Springs Day
Bought by
Watkins Demont
Purchase Details
Closed on
Aug 6, 2008
Sold by
Liggins Lee Ann and Liggins James R
Bought by
Springs Day
Purchase Details
Closed on
May 6, 2008
Sold by
Harnishfeger Michael A and Harnishfeger Barbara J
Bought by
Liggins Lee Ann and Liggins James R
Purchase Details
Closed on
Dec 11, 1992
Bought by
Harnishfeger William S
Create a Home Valuation Report for This Property
The Home Valuation Report is an in-depth analysis detailing your home's value as well as a comparison with similar homes in the area
Home Values in the Area
Average Home Value in this Area
Purchase History
| Date | Buyer | Sale Price | Title Company |
|---|---|---|---|
| Haithcock Gordon E | -- | None Listed On Document | |
| Forcefield Construction Llc | -- | None Available | |
| Ja Stinsx Llc | $5,000 | None Available | |
| Watkins Kaylean | -- | None Available | |
| Daniel Bobby K | $21,943 | None Available | |
| Watkins Demont | $1,000 | None Available | |
| Springs Day | $1,000 | None Available | |
| Liggins Lee Ann | $1,000 | None Available | |
| Harnishfeger William S | $45,000 | -- |
Source: Public Records
Tax History Compared to Growth
Tax History
| Year | Tax Paid | Tax Assessment Tax Assessment Total Assessment is a certain percentage of the fair market value that is determined by local assessors to be the total taxable value of land and additions on the property. | Land | Improvement |
|---|---|---|---|---|
| 2024 | $513 | $11,270 | $2,450 | $8,820 |
| 2023 | $498 | $10,750 | $2,350 | $8,400 |
| 2022 | $601 | $10,750 | $2,350 | $8,400 |
| 2021 | $680 | $10,750 | $2,350 | $8,400 |
| 2020 | $636 | $11,800 | $1,370 | $10,430 |
| 2019 | $636 | $11,800 | $1,370 | $10,430 |
| 2018 | $630 | $11,800 | $1,370 | $10,430 |
| 2017 | $560 | $11,800 | $1,370 | $10,430 |
| 2016 | $647 | $11,800 | $1,370 | $10,430 |
| 2015 | $898 | $11,840 | $1,370 | $10,470 |
| 2014 | $898 | $16,630 | $1,400 | $15,230 |
| 2013 | $2,143 | $16,630 | $1,400 | $15,230 |
Source: Public Records
Map
Nearby Homes
- 11 Unit Multi Family and Sfh
- 705 W Elm St
- 426 S Baxter St
- 325 N McDonel St
- 419 S Collett St
- 627 Brice Ave
- 720 S Metcalf St
- 711 W Kibby St
- 434 N Washington St
- 145 S Pine St
- 129 S Pine St
- 745 Brice Ave
- 380 S Pine St
- 14 House Package
- 343 S Charles St
- 785 Holly St
- 620 E Elm St Unit 1/2
- 612 N Metcalf St
- 606 N West St
- 708 N Metcalf St
- 411 W Elm St
- 308 S Pierce St
- 316 S Pierce St
- 407 W Elm St
- 327 S McDonel St
- 302 S Pierce St
- 322 S Pierce St
- 339 S McDonel St
- 326 S McDonel St
- 328 S Pierce St
- 381 S McDonel St
- 238 S Pierce St
- 330 S McDonel St
- 334 S McDonel St
- 317 S Pierce St
- 332 S Pierce St
- 329 W Elm St
- 334 S Pierce St
- 325-327 Pierce S