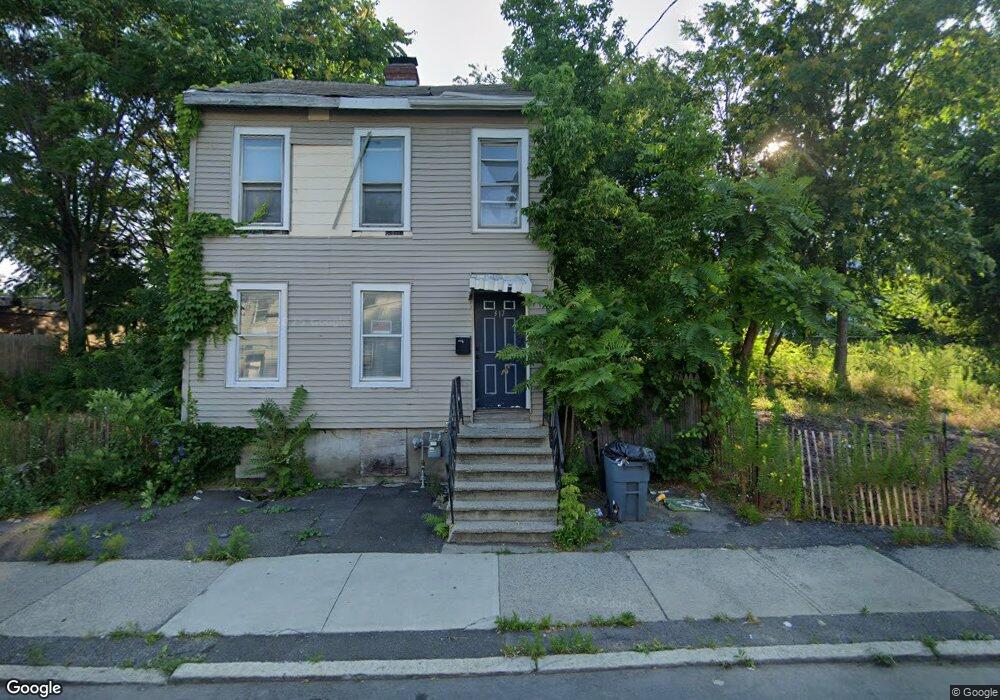
315 Sherman St Albany, NY 12206
West Hill NeighborhoodEstimated Value: $89,000 - $288,000
1
Bed
1
Bath
800
Sq Ft
$202/Sq Ft
Est. Value
About This Home
This home is located at 315 Sherman St, Albany, NY 12206 and is currently estimated at $161,371, approximately $201 per square foot. 315 Sherman St is a home located in Albany County with nearby schools including Stephen And Harriet Myers Middle School, Roots Academy at West Hill, and Albany High School.
Ownership History
Date
Name
Owned For
Owner Type
Purchase Details
Closed on
Oct 26, 2018
Sold by
County Of Albany
Bought by
Albany County Land Bank Corporation
Current Estimated Value
Purchase Details
Closed on
May 6, 2008
Sold by
Burke Paul
Bought by
Rigney Thomas
Home Financials for this Owner
Home Financials are based on the most recent Mortgage that was taken out on this home.
Original Mortgage
$58,500
Interest Rate
5.91%
Mortgage Type
New Conventional
Purchase Details
Closed on
Sep 19, 2006
Sold by
Garhartt Brenda
Bought by
County Of Albany
Purchase Details
Closed on
Sep 5, 2006
Sold by
County Of Albany
Bought by
Burke Paul
Purchase Details
Closed on
Jul 18, 1997
Sold by
St Pierre L Charles
Bought by
Garhartt Brenda
Create a Home Valuation Report for This Property
The Home Valuation Report is an in-depth analysis detailing your home's value as well as a comparison with similar homes in the area
Home Values in the Area
Average Home Value in this Area
Purchase History
| Date | Buyer | Sale Price | Title Company |
|---|---|---|---|
| Albany County Land Bank Corporation | -- | None Available | |
| Rigney Thomas | $65,000 | -- | |
| Rigney Thomas | $65,000 | The Judicial Title Insurance | |
| County Of Albany | -- | -- | |
| Burke Paul | $10,000 | -- | |
| Burke Paul | $10,000 | None Available | |
| County Of Albany New York | -- | None Available | |
| Garhartt Brenda | $20,000 | -- |
Source: Public Records
Mortgage History
| Date | Status | Borrower | Loan Amount |
|---|---|---|---|
| Previous Owner | Rigney Thomas | $58,500 |
Source: Public Records
Tax History Compared to Growth
Tax History
| Year | Tax Paid | Tax Assessment Tax Assessment Total Assessment is a certain percentage of the fair market value that is determined by local assessors to be the total taxable value of land and additions on the property. | Land | Improvement |
|---|---|---|---|---|
| 2024 | -- | $3,000 | $3,000 | $0 |
| 2023 | -- | $1,500 | $1,500 | $0 |
| 2022 | -- | $1,500 | $1,500 | $0 |
| 2021 | $0 | $1,500 | $1,500 | $0 |
| 2020 | $177 | $1,500 | $1,500 | $0 |
| 2019 | $1,296 | $1,500 | $1,500 | $0 |
| 2018 | $212 | $1,500 | $1,500 | $0 |
| 2017 | $24,689 | $1,500 | $1,500 | $0 |
| 2016 | $24,958 | $12,000 | $2,900 | $9,100 |
| 2015 | $1,073 | $25,000 | $5,300 | $19,700 |
| 2014 | -- | $25,000 | $5,300 | $19,700 |
Source: Public Records
Map
Nearby Homes